Does an extension add value? 135,769 London homes, sold twice
An extension adds what the new square metres are worth, no more. Simply obtaining planning permission might deliver the best pound for pound return.
9 October 2026
Thinking of selling? The neighbours extended, and you wonder what an extension would really add to your home. We crunched 135,769 London homes that sold twice since 2015, with a certified floor area at each sale and the planning file for everything in between. A home priced before and after its own extension is about as clean a comparison as the question allows.
Live map — planning applications near you
Loading the applications…
Last 12 months, c/o the PlanIt aggregator and the Irish national planning register (CC BY 4.0). Each application links to the council’s own page where the register provides one.
How the comparison works
Start with the counting, because the groups matter. Of the 135,769 homes, 79,922 are flats and 53,628 are houses. We set aside 887 listed buildings, and 1,332 the Land Registry cannot class as a house or a flat: mixed use titles such as a shop with the flat above, live work units, and titles covering more than one home.
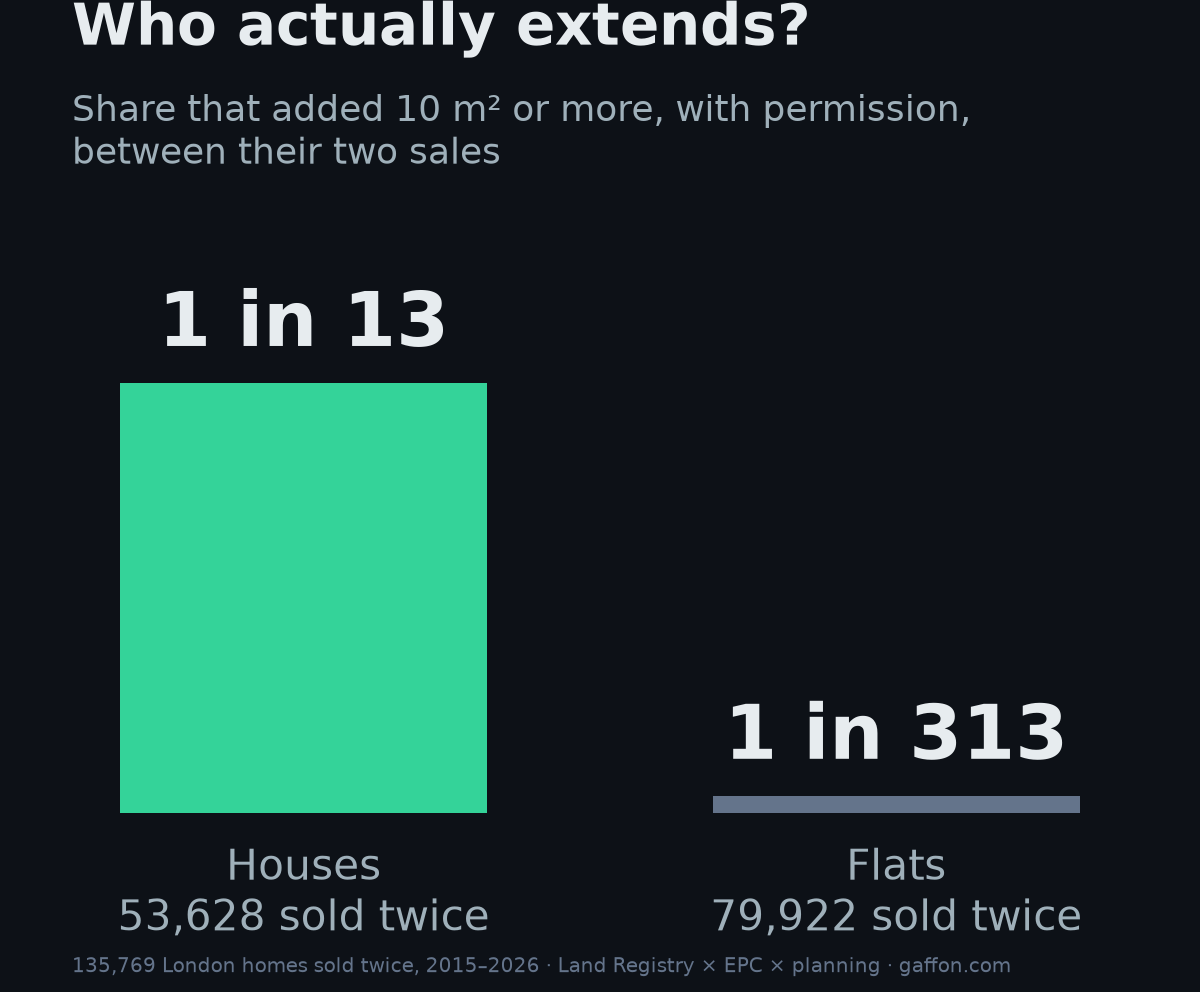
Flats almost never extend. Of the 79,922 flats, 255 extended with permission: 1 in 313, against 1 in 13 for houses. A flat usually has no garden to build into, no roof it owns, and a freeholder in the way. The few that built added 24 square metres at the median and sold 25% higher in total, but finished 11% behind their market per square metre. So extensions are a house story, and the rest of this piece sorts the houses.
We sorted the 53,628 houses using the planning register and the certified floor area at each sale. 32,450 filed no application and stayed the same size. 5,539 obtained permission and never built. 4,262 obtained permission and grew by at least 10 square metres. The remaining 11,377 were messy (refused applications, houses that grew with no permission on file, houses that shrank) and sit out of the comparison.
Each group is scored the same way: the home's own price growth between its two sales, minus the growth of the typical home in its borough over the same years. Positive means it beat its borough, negative means it lagged. One quirk to know before the chart: the borough average includes flats, and flats performed badly, so an ordinary house that filed nothing still scores about 3% above it. Compare the bars with each other, not with zero.
An extension adds what the metres are worth
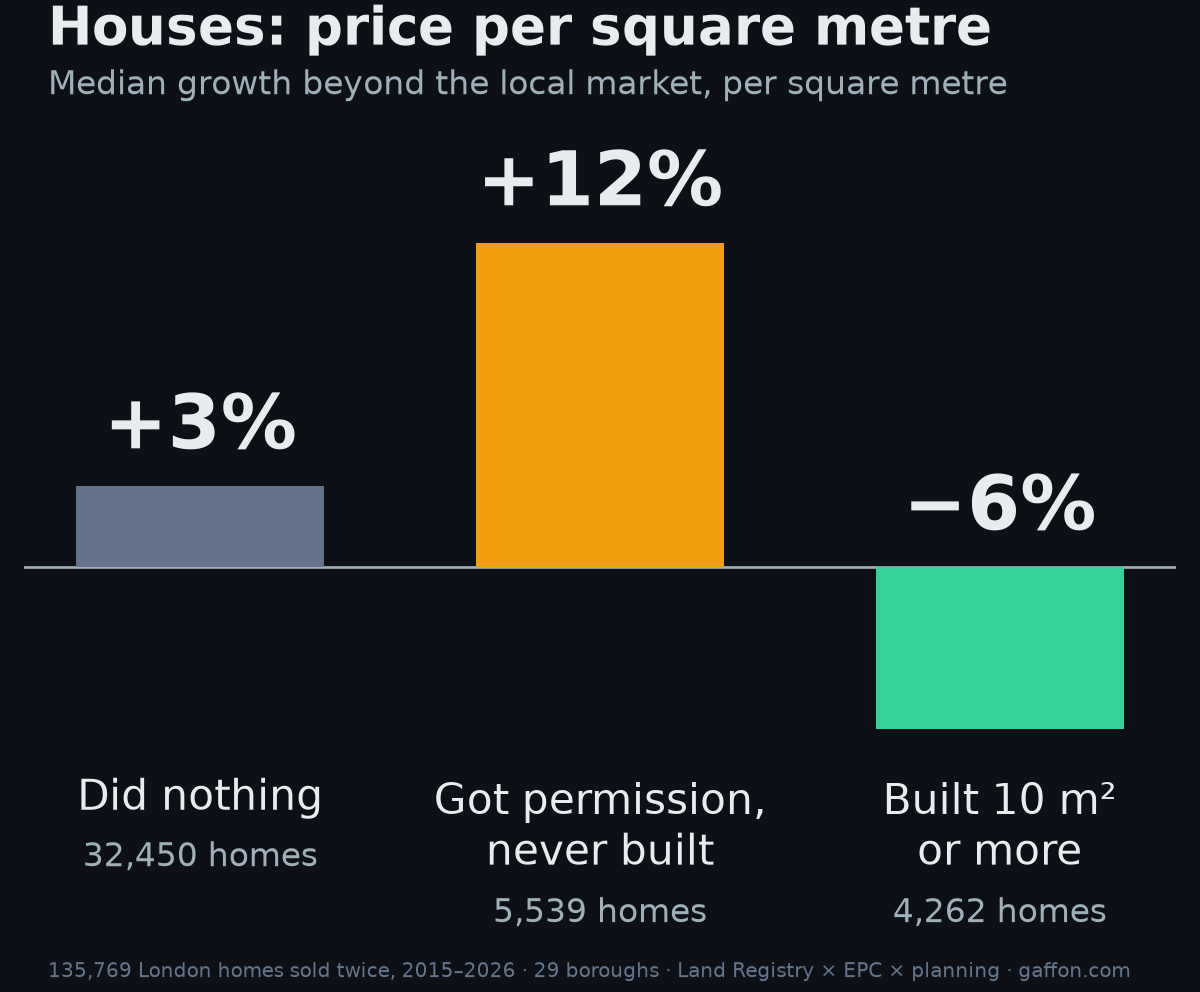
Houses that extended scored 9 points per square metre below the houses that filed nothing. In total price they scored 31% ahead, because the house got bigger. Both are true at once: the extra money is new floorspace selling at the going rate, not a reward for the work.
Renovation without extension shows up in the same data. An energy inspection scores every home from 1 to 100. Of the 32,450 houses that never filed an application, 2,848 improved that score by 10 points or more between sales, which means real work: insulation, a new boiler, new windows. They scored 5% per square metre, against 3% for the other 29,602. Call it 2 points for a renovation that needs no permission.
Say your house is 100 square metres (multiply by ten for a rough square feet figure) and your local rate is £7,000 per square metre, close to the London average. A 20 square metre extension takes the home from £700,000 to about £840,000. Subtract the build cost and the planning fees and what is left is your profit. It may not be much.
Live tool — what your home is worth per square metre
The permission alone is worth 12%
Houses that obtained permission and never built sold 12% above their local market, 9 points above the houses that filed nothing, on 5,539 homes with floor area unchanged. Not a speck of dust, not a spade in the ground, and the whole property sells at a premium. It is not hidden renovation: homes whose energy score never moved still show 13%, on 4,594. We read this as option value. The next buyer pays for the right to extend without the risk of asking. Set that against the 31% total gain from building: 12 of those 31 points were available without laying a brick.
If you are selling and have the time, this is the investment to consider. After ten years in a house you know every flaw. Talk to an architect, sketch the layout you would want, file the application, and the home can carry that premium without a brick laid.
Sketch your extension with the free floorplan toolWhy is paper worth so much?
Because planning in London is a gamble. There is no single rulebook. Each borough decides for itself, and one application in six is refused: 180,004 of the 1,132,807 decided across 29 London boroughs in the last decade. Among the refusals, 1,890 mention double glazing, including one that proposed exact design replica wooden double glazed sash windows, painted white. Refused. In a city where three in ten homes predate 1930 (about 1.4 million of the 4.6 million energy certificates we hold), the right to improve is never guaranteed, so consent in hand commands a premium. Every refusal is a story, and we are reading them for a follow up piece.
Terraces, semis, detached, flats: same verdict
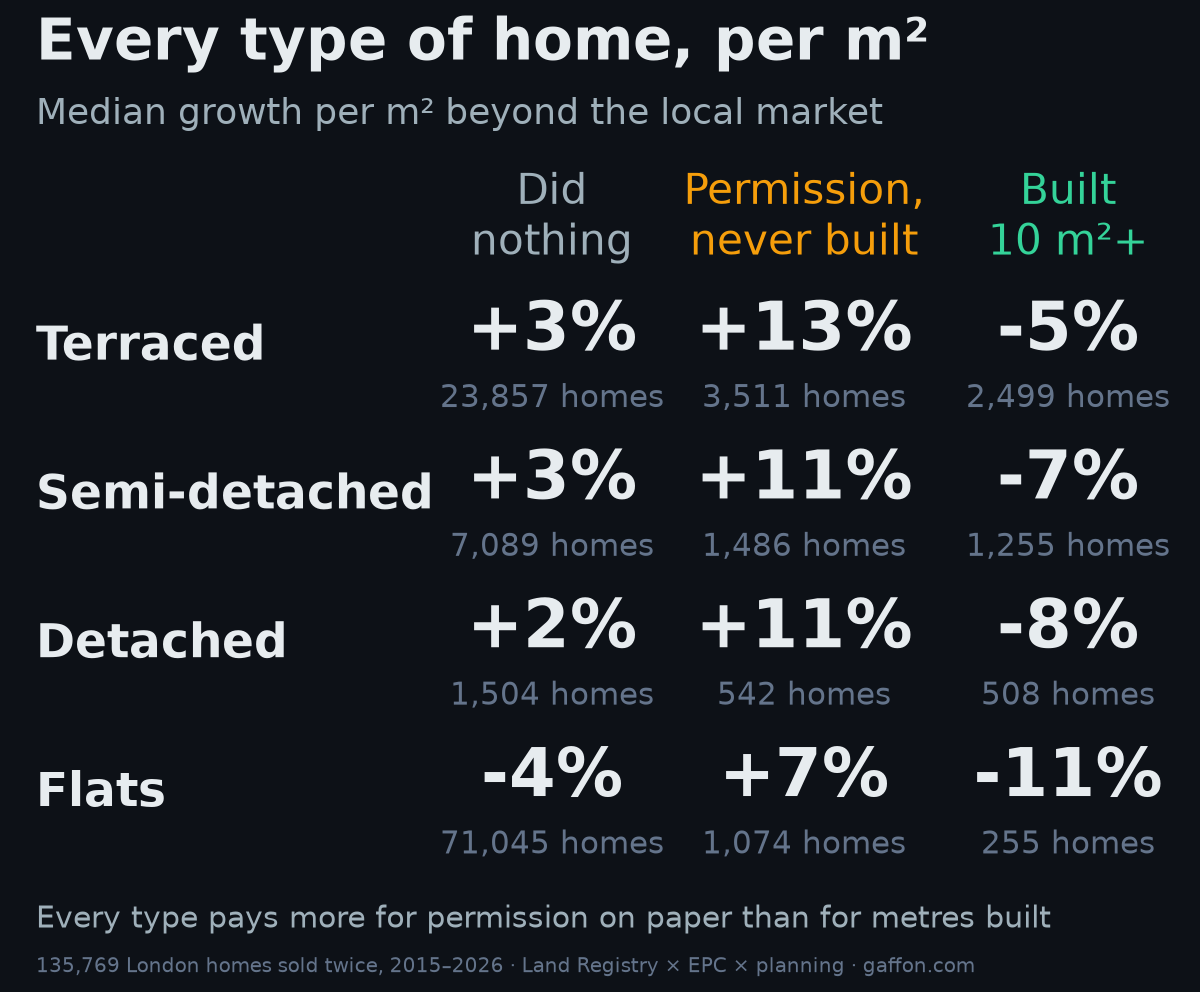
In all four types, the homes that extended made less per square metre than the homes that did nothing, and in all four, permission on paper carried a premium.
Where extending pays
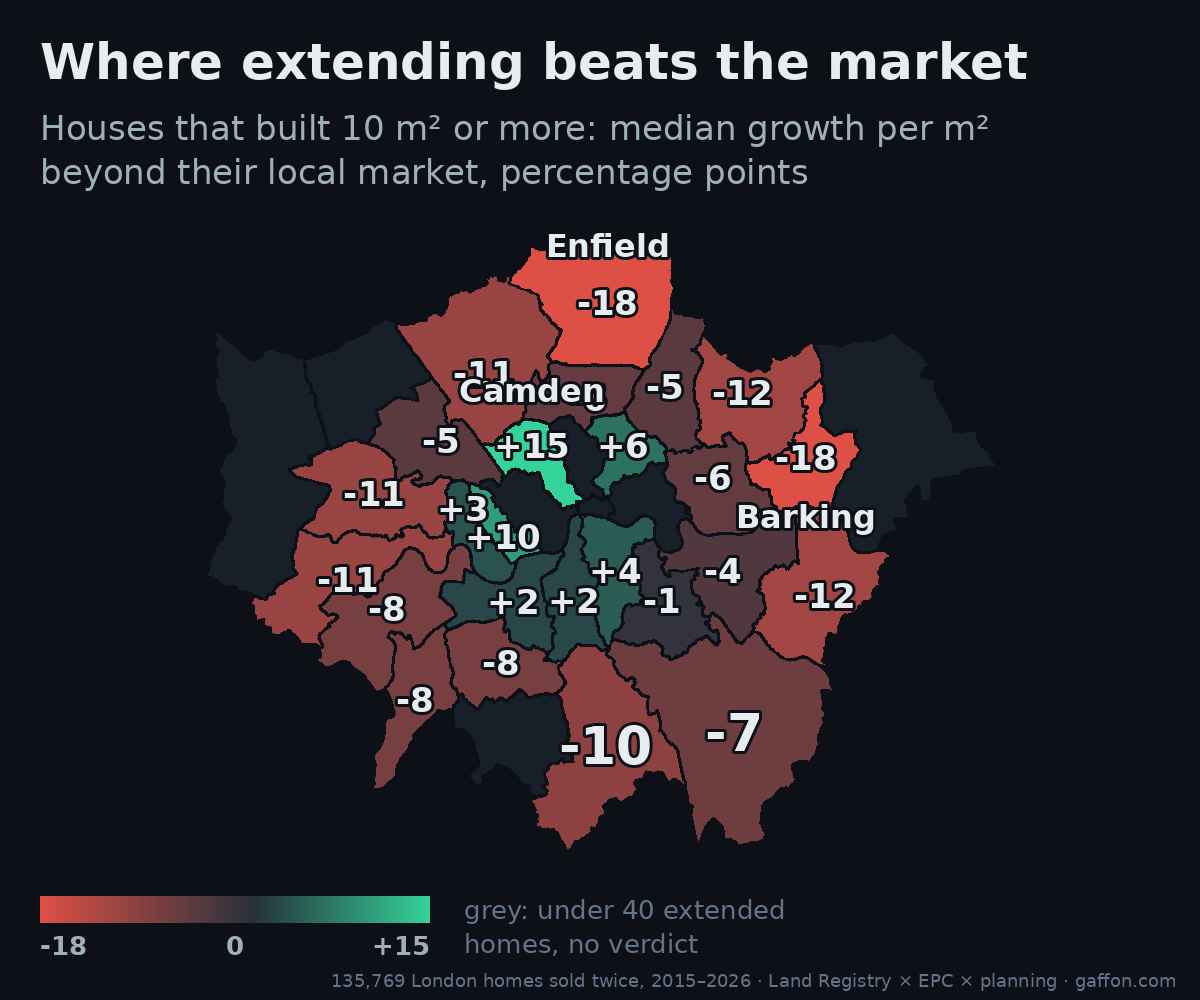
In Camden the 52 owners who extended beat their local market by 15% per square metre. The 80 in Kensington and Chelsea cleared 10%. At the other end, Enfield's 109 and Barking and Dagenham's 50 finished 18% behind. Where a square metre is dearest and moving is hardest, new metres can beat the market. On the outer edges, where the bigger house next door is cheaper than the build, they do not.
Loft, extension or basement
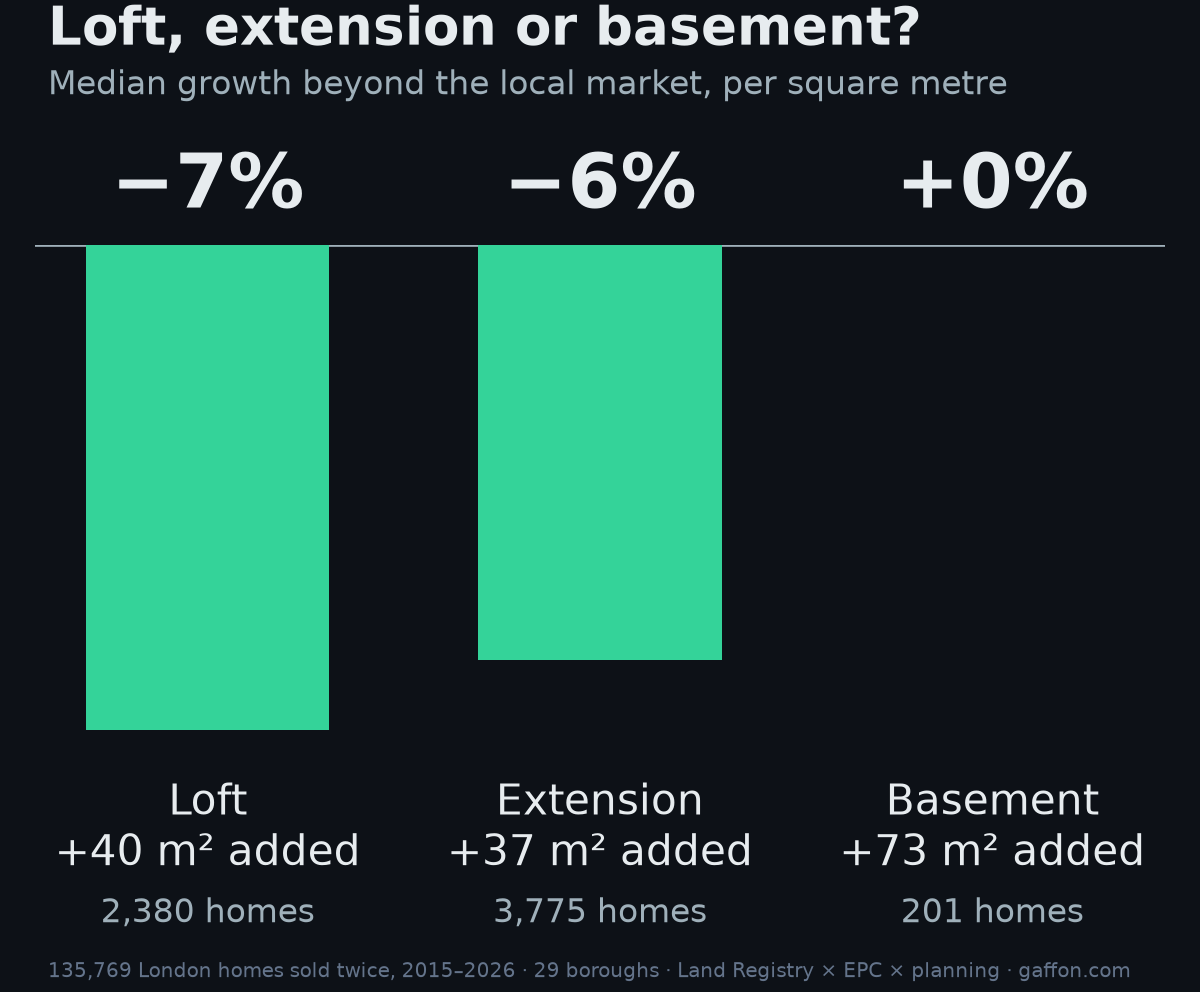
All three sit within seven points of the market per square metre. The totals people quote, 34% for a loft or 55% for a basement, are size rankings in disguise: basements are simply huge, 73 median square metres.
How we measured it
Land Registry price paid records find every home sold twice in 29 of London's 33 boroughs. The EPC register gives floor area and energy score at each sale. Borough planning registers give every application in between, 1,132,807 decided in all. Built means the floor grew by 10 square metres or more. Listed buildings excluded. Medians throughout.
Ready to list your home?
Free for everyone — no fees, no commission. The wizard walks you through it, step by step.
List my home — free →Looking to buy?
Every home on one map, with video tours.
View homes for sale →More from the Gaffon blog
- Who owns London? The offshore map →
- Oxford v Cambridge house prices →
- Off-market listings: the advantages →
- How to film a video tour that sells your house →
- Can I sell my house without an estate agent? →
- What did my neighbour's house sell for? →
- Do I need an EPC to sell my house? →
- Sea view homes for sale UK: £599k to £950k →
- UK coastal homes under £500k →