Oxford v Cambridge — and this time it's academic
Cambridge's core trades at £458,000 and Oxford's at £450,450 — nine-tenths of London, double their own twins. And since 2015 they've grown at a quarter of England's pace. The gown giveth and the gown capped it.
28 September 2026
Every August two English cities pretend to be rivals for a boat race and a league table. Their housing markets stopped pretending years ago: they are the same market, and it isn't the market of the cities around them. This is a story about what a world-leading university does to the price of a terraced house — told from the sale registers of both.
Two cities trading like a third
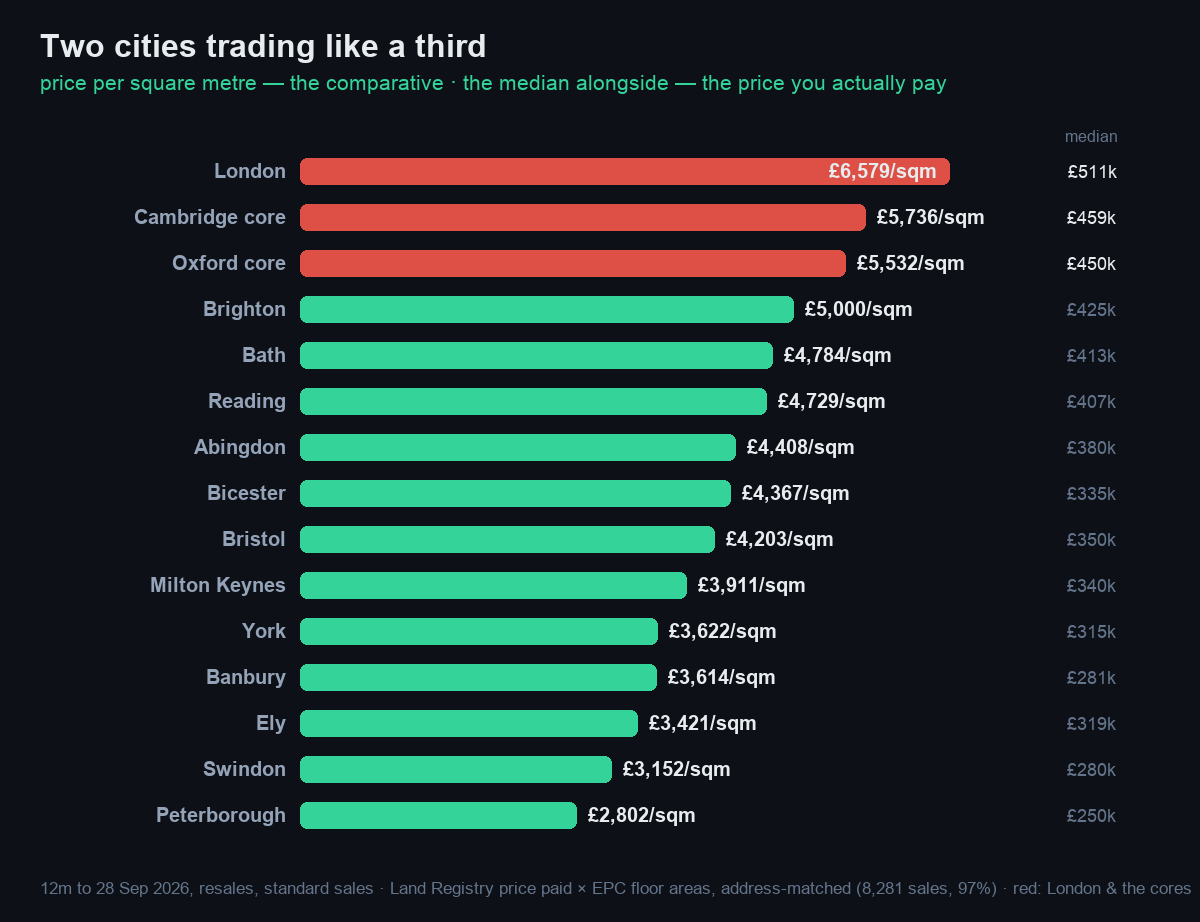
Take the last 12 months of resales from the Land Registry. Cambridge's city core (CB1–CB5) has a median of £459,000; Oxford's (OX1–OX4) £450,000. Greater London's median is £511,000. Two provincial cities of 150,000 people trade at roughly nine-tenths of London — while England as a whole sits at £300,000, Birmingham at £260,000, Manchester at £254,375. Even the prosperous comparators sit a tier below: Brighton £425,000, Bath £413,000, Bristol £350,000. Only Reading (£407,000), London's own commuter annex, gets close. The chart ranks the whole set by price per square metre — the cleanest like-for-like there is — with the median alongside; why we lead with the square metre is explained below.
The twins next door
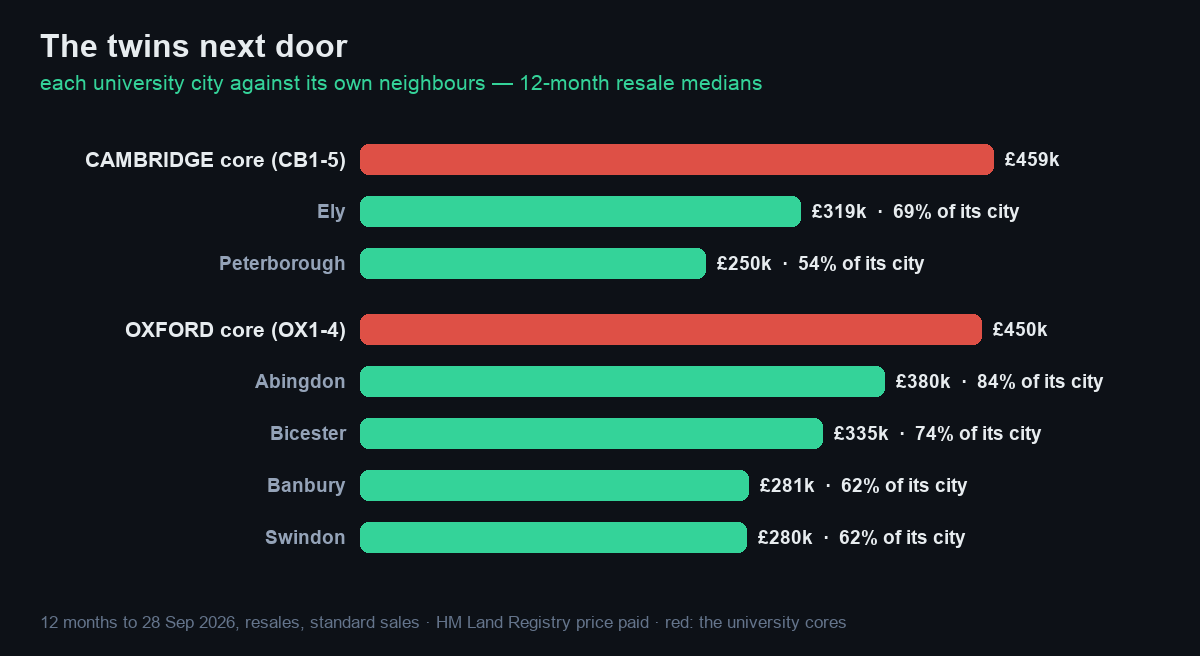
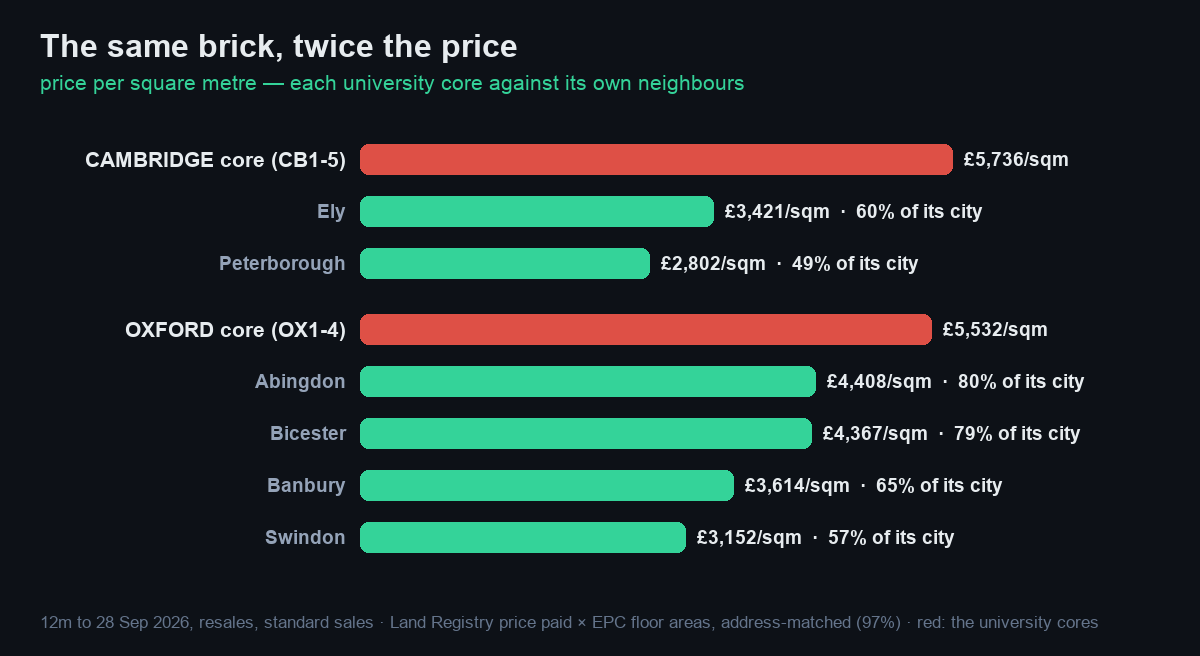
National comparisons flatter every southern city, so hold each one against its own neighbours instead. Twenty minutes up the line from Cambridge is Ely — same fens, same trains, its own cathedral — and its median is £317,500: 69% of Cambridge. Half an hour further is Peterborough, a proper regional city three times Ely's size, at £223,000 — less than half. Oxford tells the same story: Banbury, in Oxford's own postcode area, trades at £280,500 (62% of Oxford); Swindon, the region's workhorse, at £260,000. Even the prosperous market towns in the universities' shadow — Abingdon £380,000, Bicester £335,000 — sit well below the two cores. The premium isn't the south of England. It's the gown.
The terrace test
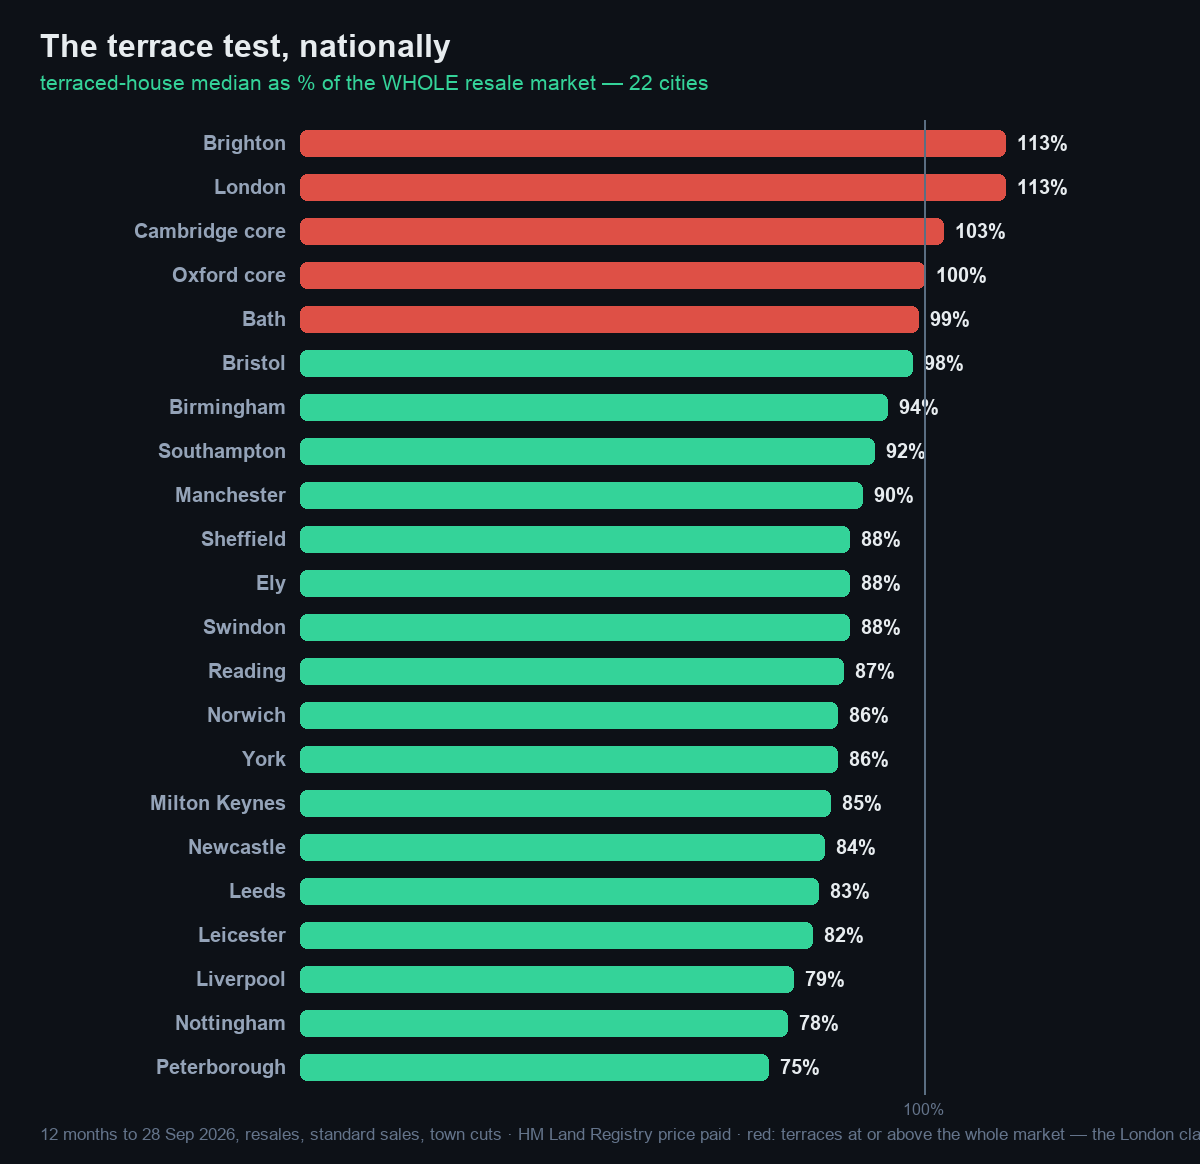
Here's the cleanest way to see it. In a normal English city the terraced house is the cheap seat of the market: against the whole resale median, terraces trade at 79% in Peterborough, 85% in York, 87% in Birmingham, 88% in Ely, 90% in Manchester. In Cambridge's core the terrace trades at 104% of the whole market — above it — and in Oxford's core at 100%. There is exactly one other market in England that behaves like that: London (113%). Where land is the asset and location is everything, the humble two-up-two-down stops being the bottom rung — £475,000 in Cambridge, £450,000 in Oxford.
We ran the same test on 22 cities and it holds nationally: in nineteen of them the terrace trades below the whole market — Peterborough at the floor on 75%, Nottingham 78%, Liverpool 79%. Exactly five reach parity or better: London (113%), Brighton (113%), Cambridge (103%), Oxford (100%) and Bath (99%). Brighton needs explaining, and the explanation is flats: 34.5% of everything sold in Brighton in the last year was a flat — the highest share in England outside London's 49.6% — and where flats own the cheap end of the register, the terrace becomes the family house and prices at a premium. Cambridge (29% flats) gets some of the same tailwind; Oxford manages parity with a normal flat share of 21%, which makes its terrace market arguably the strangest in the country. Bath is the honourable mention: Georgian terraces are the whole point of Bath. The test is really measuring one thing — in most of England the terrace is what you settle for; in the London class it's what you're bidding for.
The rates of change — and the twist
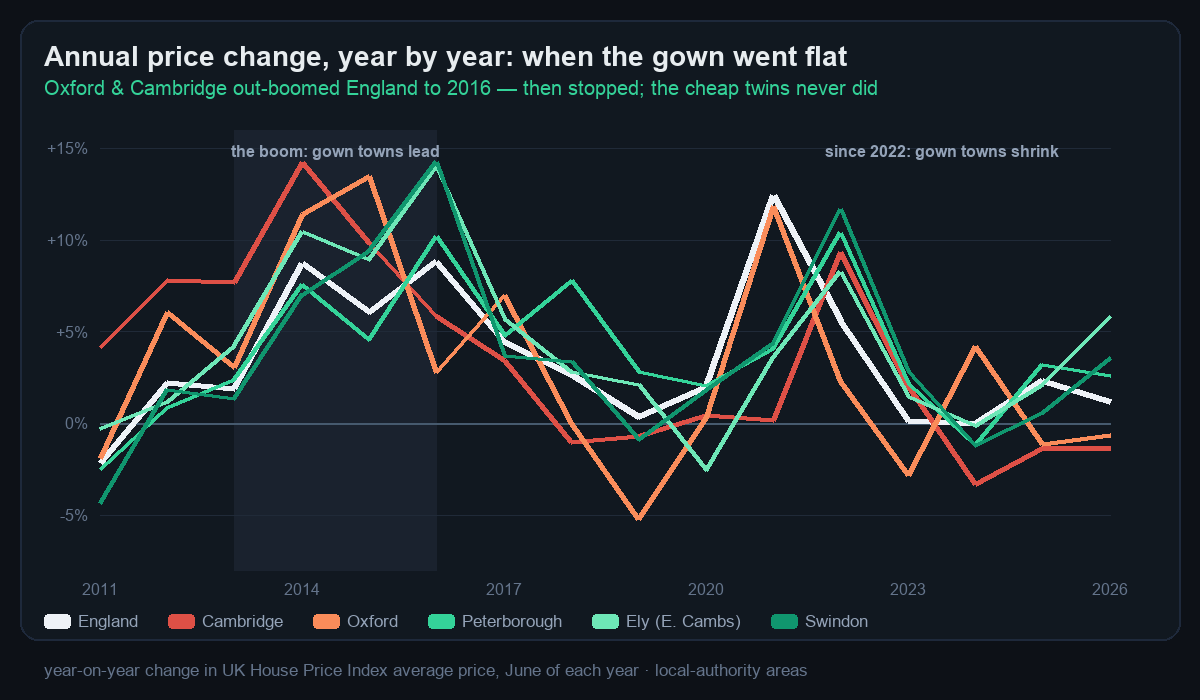
Year by year, the timing is unmistakable. Through the boom of 2013–16 the gown towns led the country — Cambridge put on 14% in a single year. Then, from 2017, the lines swap: England and the cheap twins keep compounding while Oxford and Cambridge hug zero, and since 2022 both cores have been outright shrinking (Cambridge's June reading has fallen three years running). Whatever capped these two markets arrived around 2016–17 — right when prices hit ten-times-plus local earnings — and it has never lifted.
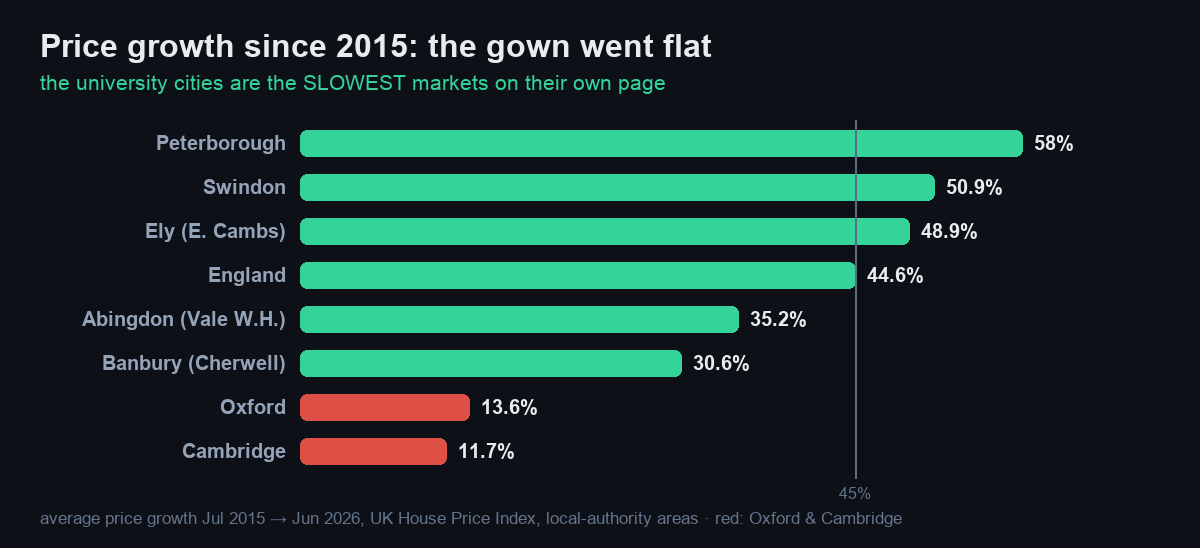
Growth turns the story on its head. Since July 2015, the official House Price Index says England is up +45%. Cambridge is up +11.7% and Oxford +13.6% — the two slowest-growing markets on this page. Meanwhile their twins sprinted: East Cambridgeshire (Ely) +49%, Swindon +51%, Peterborough +58%. The university cities hit their London-class ceiling a decade ago and then went London-flat, while the money they priced out spent ten years bidding up every town on the branch line. If you want the appreciation, you buy near the gown, not under it — the same dear-to-cheap rotation we've measured in Dublin and in London itself.
The comparative that matters: the square metre
Two numbers run through this piece. The median is the real one — houses are all-or-nothing, nobody buys 40 square metres of a £5M house — so it's what you'd actually pay. But as a comparison between places it can mislead: a city that sells big houses looks dearer than one that sells small flats. The price per square metre is the honest comparative, so we joined every sale in these markets to its Energy Performance Certificate (which records floor area) — the same method behind our London-by-the-square-metre page — 8,281 sales, a 97% match — and per square metre the ranking above holds: London £6,579, Cambridge core £5,736, Oxford core £5,532, then daylight — only Brighton (£5,000) and Bath (£4,784) get within £800 of the cores. The twins below are the sharper cut. Oxford's ring towns stay inside its gravity: Abingdon £4,408 and Bicester £4,367 hold about 80% of the core. Cambridge's twins fall off a cliff at the city line: Ely £3,421 is 60%, Peterborough £2,802 under half. Square metre for square metre, the same brick in Cambridge costs twice what it does 30 miles up the road.
The top end
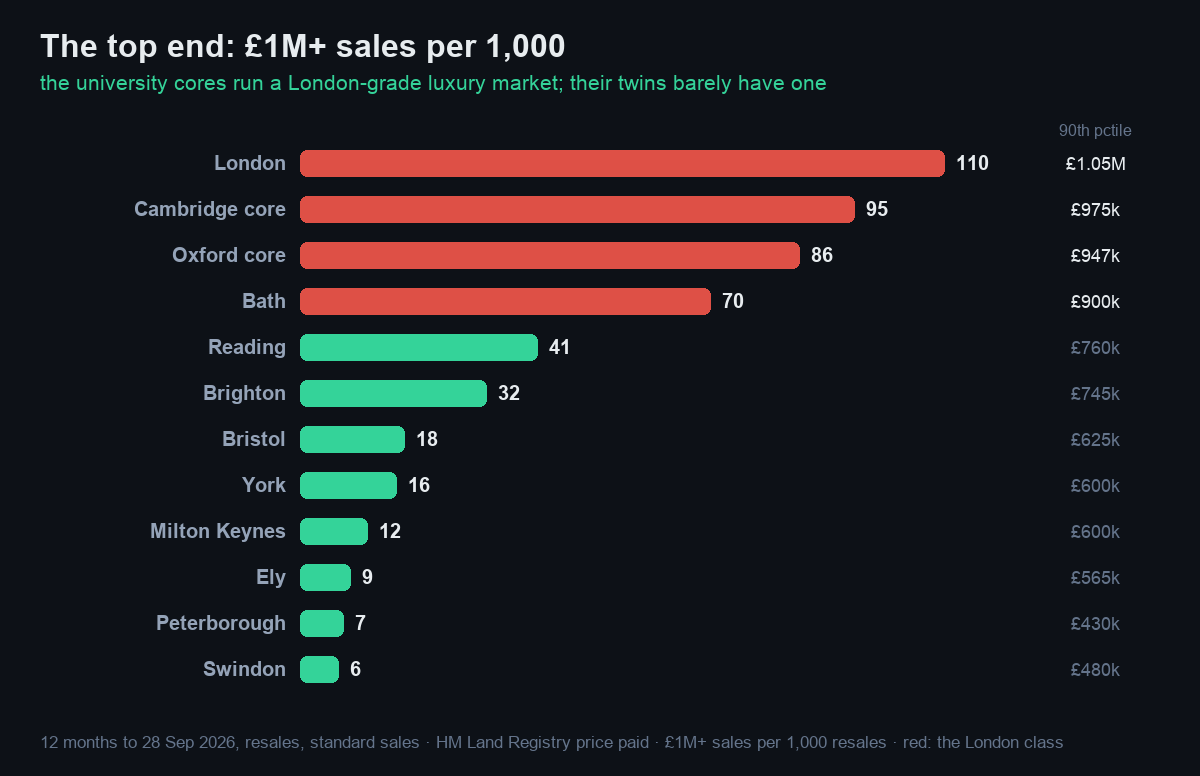
Cheap-end dynamics aren't the whole story — what about big property? Count the £1M+ resales per 1,000 sales and the two cities run a London-grade luxury market: London 110 per 1,000, Cambridge core 95, Oxford core 86 — then Bath at 70, a long gap, and the twins at single digits (Ely 8.6, Peterborough 7.4, Swindon 6.5). The 90th-percentile price tells the same story: £975,000 in the Cambridge core and £947,000 in Oxford's against London's £1.05M — and £565,000 in Ely. The dearest resale in the Cambridge core this year was £5M; Ely's was £1.25M. Note who keeps joining the university cities in every one of these tests: Bath — the other small English city where the housing stock itself is the institution.
The hypothesis
Both cities have the same three ingredients and almost nothing else in common with their regions: a world-leading university, the employment cluster it seeds (labs, spinouts, science parks), and a permanent tide of young, educated, well-paid arrivals — plus a planning belt that stops the cities growing to meet them. Town and gown, priced accordingly.
Who actually owns the two cities?
The answer comes from joining two public registers, in order. Step one: Companies House. The PSC register records who controls every UK company — search it for the universities and colleges as controllers and you get the complete list of companies they own. Step two: the Land Registry. Its corporate-ownership files (CCOD, and its overseas twin OCOD) list every property in England and Wales owned by any company or corporate body — and that includes the colleges themselves, ancient corporations that hold land under their own legal names. The companies from step one, plus the colleges by name, give the full estate — on the public record.
Step one, in plain terms. Companies House keeps a register of every UK company's controlling owners — 16 million control records covering 5.7 million companies. We searched the whole thing for one pattern: companies whose controlling owner is the University of Oxford, the University of Cambridge, or one of their colleges. The result is startlingly small: 26 companies in the entire country. The table below is not a sample — it is all of them.
So what are they, and where? Overwhelmingly property vehicles registered at the colleges' own addresses: Balliol, Exeter, Mansfield, St Antony's and Lucy Cavendish each run development or letting companies from their lodges; St John's controls Thomas White Oxford, the company building the 64-acre Oxford North district; and Magdalen College controls The Oxford Science Park Limited — registered SIC code 'development of building projects', since 1988. The exceptions prove the flavour: Magdalen holds one vehicle in Jersey, Cambridge's endowment fund runs a general partner from Mayfair, and exactly one of the 26 does actual science (Oxford Electromagnetic Solutions). The famous spin-outs are missing for a reason: a university tech-transfer stake is usually well under the 25% disclosure bar — the gown seeds companies, it doesn't control them. What it controls, wholly and formally, is land.
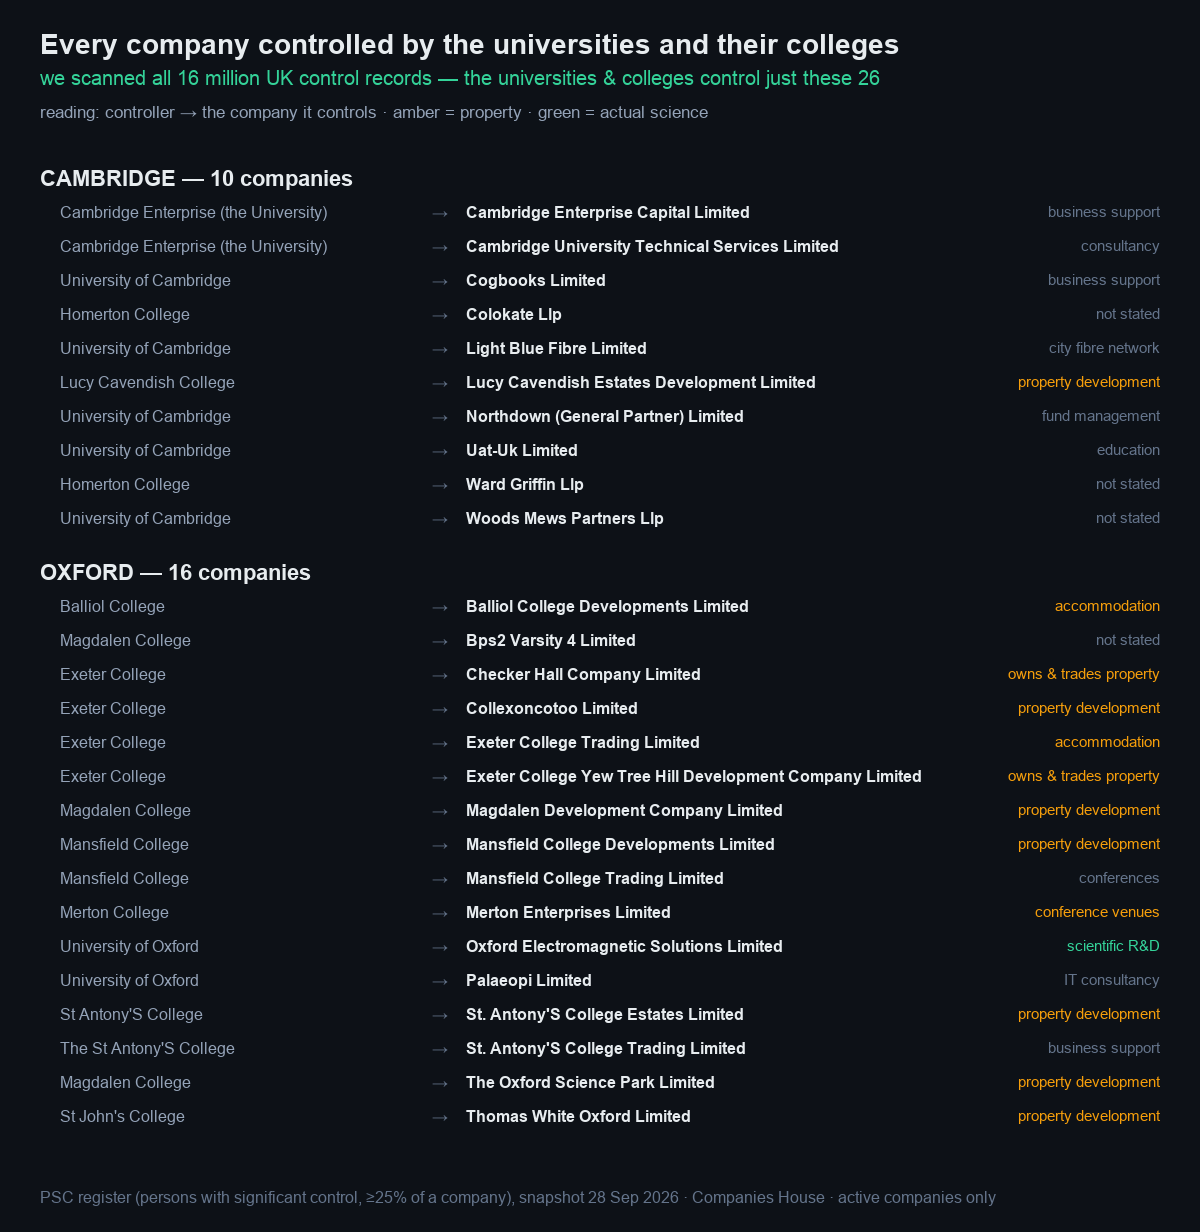
How we know this (method): Companies House publishes the PSC register — 'persons with significant control', anyone holding 25% or more of a company. We scanned all 16 million control records for controllers whose legal names are the universities or their colleges ('The Chancellor, Masters and Scholars of…', 'Rector & Scholars of Exeter College in the University of Oxford', and so on). The direction is: the college controls the company — these 26 companies are owned subsidiaries of academic institutions. The reverse (companies that control the universities) doesn't exist; universities are chartered corporations with no shareholders.
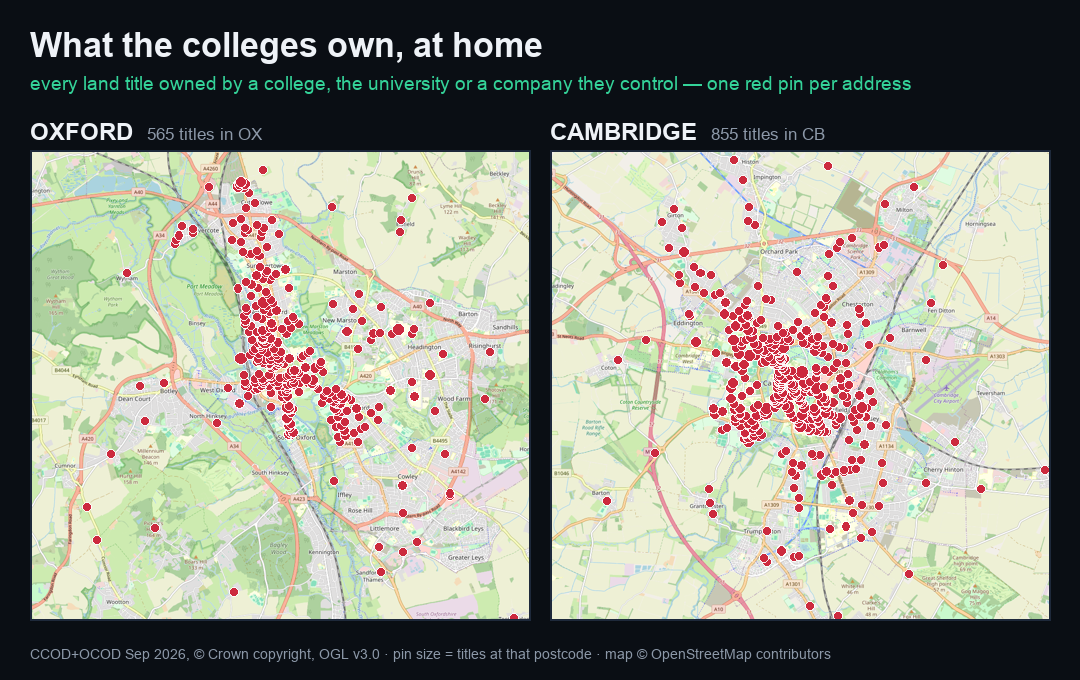
Step two: take those 26 companies — plus every college under its formal legal name (‘The Warden and the College of the Souls of All Faithful People Deceased…’ is how All Souls signs a deed) — into the land registers. The result: 3,353 registered titles in England and Wales belong to Oxbridge colleges, the two universities, or companies they control. The register also settles the science-park question from the other side: the titles at The Oxford Science Park are registered to Magdalen, and Cambridge Science Park titles to Trinity — two independent registers, same answer. Every red pin below is an address they own; the home-city maps are eight centuries of buying the street next door: a dense mass over the historic core, thinning through the suburbs.
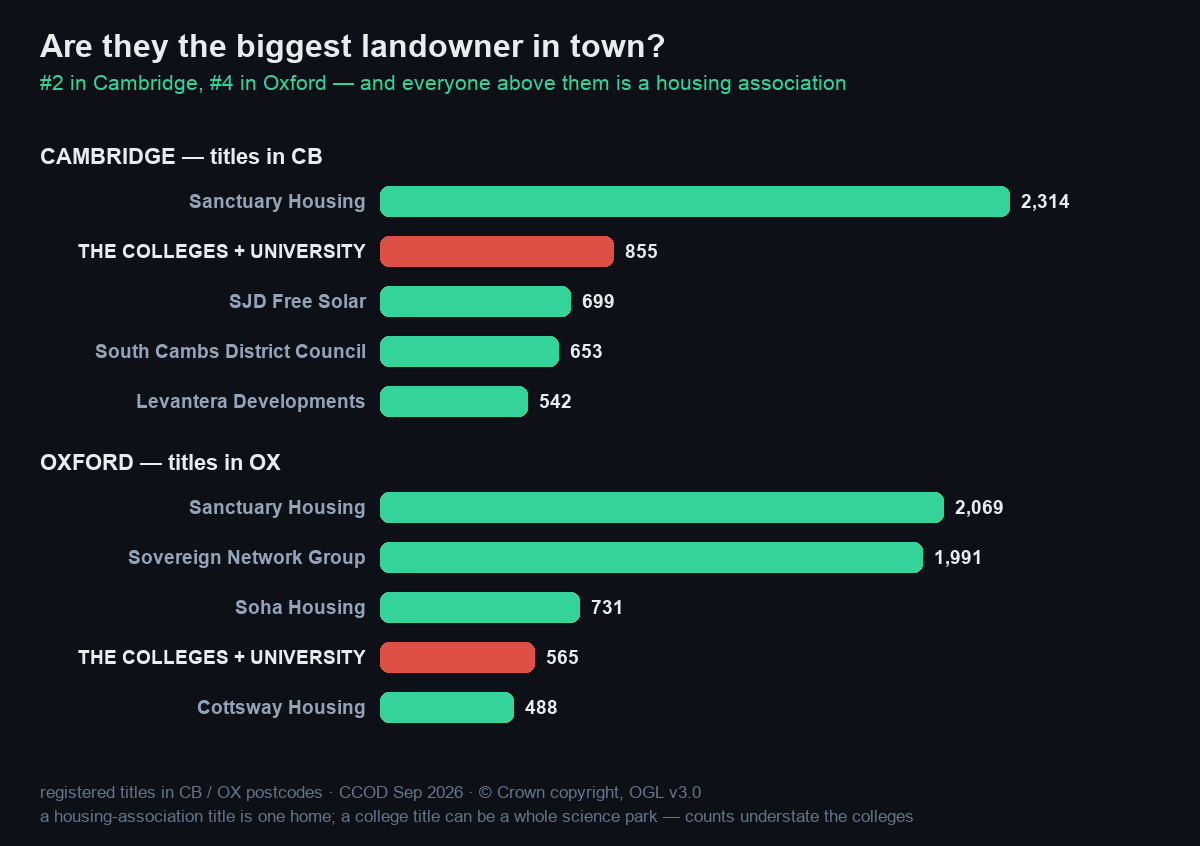
So are they the biggest landowner in town? Almost. Pool each city's colleges and university into one owner and they are the #2 holder of registered titles in Cambridge — 855 titles, behind only Sanctuary Housing's 2,314 — and #4 in Oxford (565). Everyone above them is a housing association, and the counting is biased against the colleges: a housing association's title is one semi, a college's can be a 60-acre science park. Nationally the combined 3,353 titles rank them #153 of the 915,898 corporate proprietors in England and Wales — the top 0.02%, above almost every FTSE company, for institutions whose governing bodies would fit in a lecture theatre.
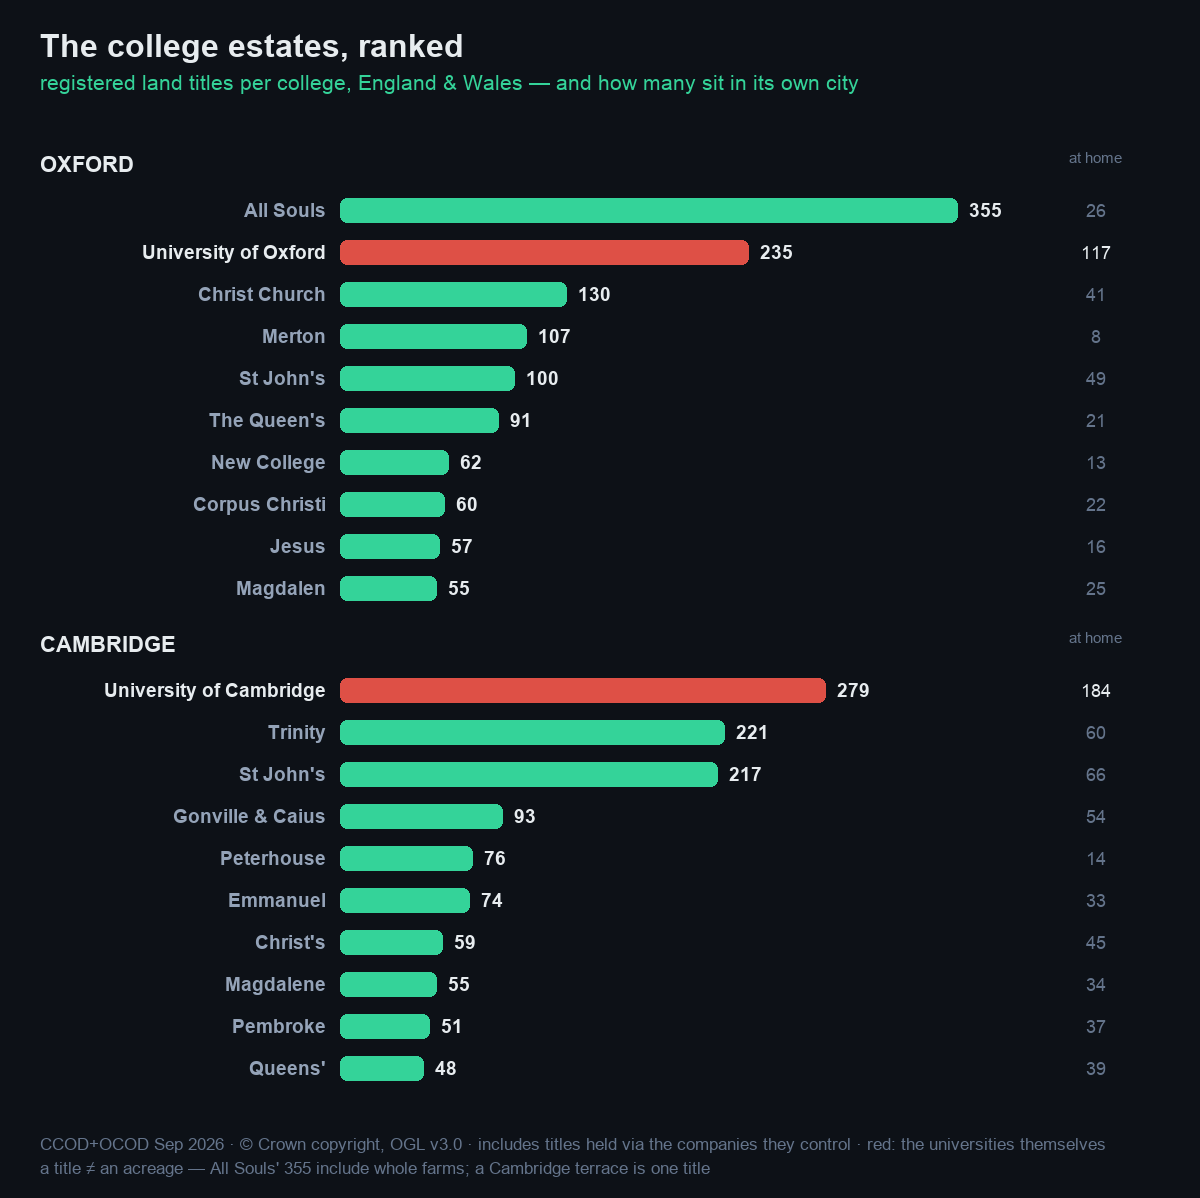
College by college, the estates split two ways. Cambridge's giants are hometown landlords: Trinity holds 221 titles (60 in Cambridge), St John's 217, and the University itself 279 — 184 of them at home, the labs and parks of the city's western edge. Oxford's map is stranger: All Souls holds 355 titles and just 26 are in Oxford — the college with no students has spent five centuries collecting London blocks and farmland instead — and Merton (107 titles, 8 at home) and Christ Church (130, 41) lean the same way.
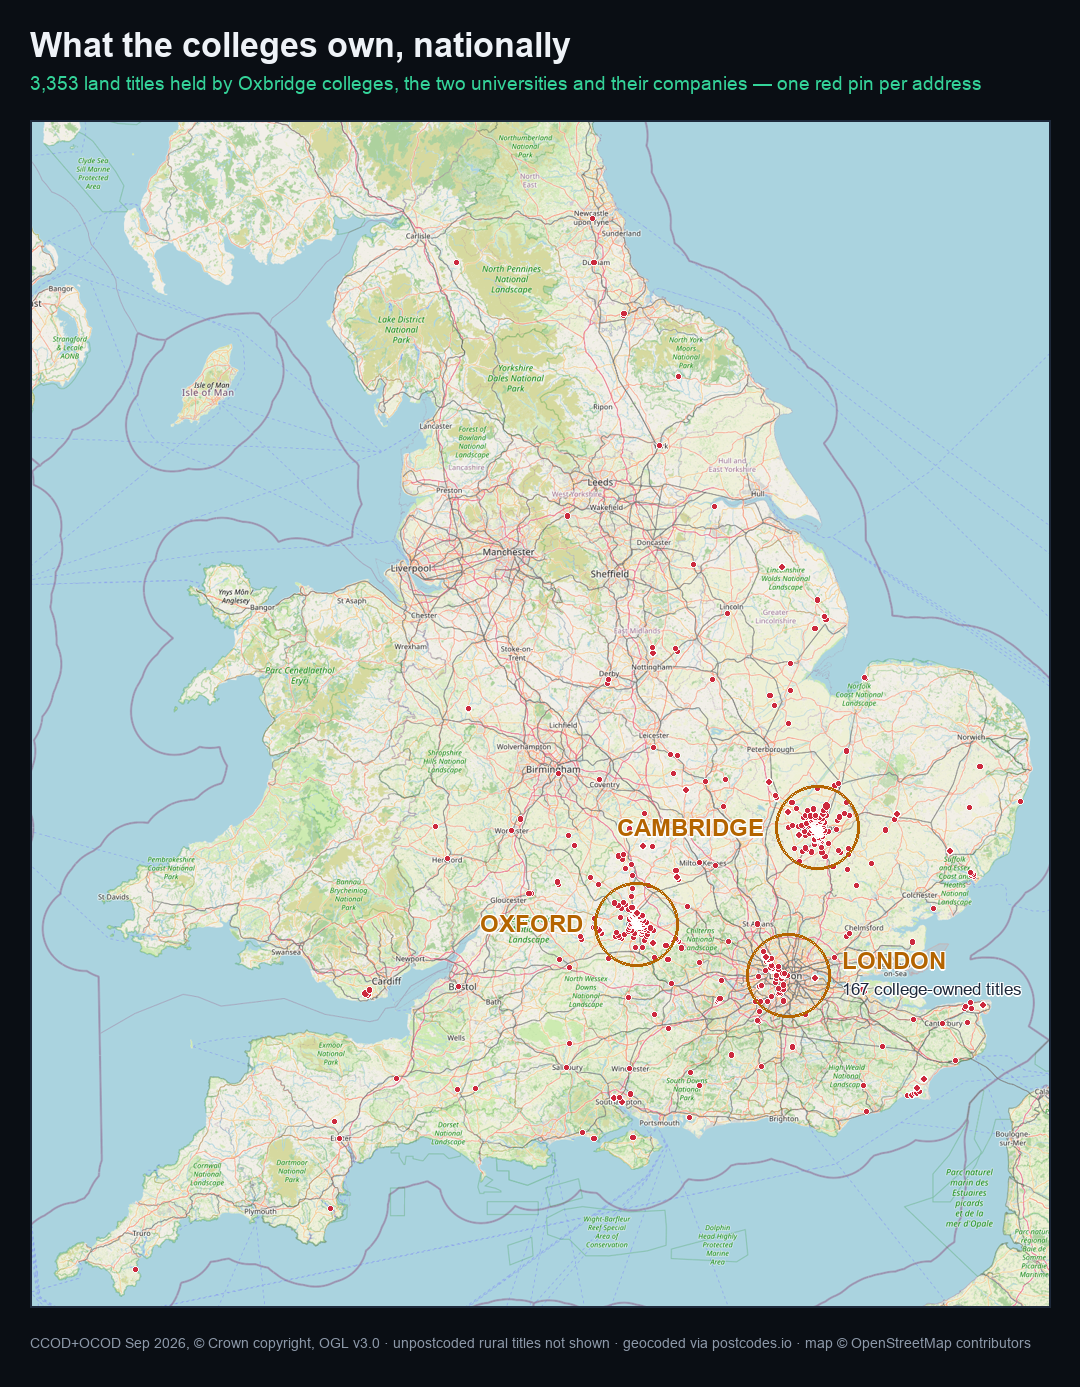
Zoom out and the whole estate appears: a mass over each home city, a third cluster in London — 167 college-owned titles — and a scatter across rural England that is exactly what a medieval endowment portfolio looks like: farms, rectories, market-town parades. And the national map understates it — unpostcoded farm titles never make it onto the map at all.
What Companies House sees
House prices tell you who can afford to live somewhere. Company registrations tell you why they bother. We took the full Companies House register — 5.7 million companies — and cut it by postcode area: the two university cities against their twins.
Cambridge has 719 active companies whose main business is scientific R&D; Oxford has 512. Per thousand active companies that's 20 in Cambridge and 11 in Oxford — against 1.9 in Peterborough and 1.6 in Swindon. Cambridge has ten times the research density of the city forty minutes up the line, and the map shows exactly where it sits: the Science Park, the city core, and the Babraham–Granta belt to the south.
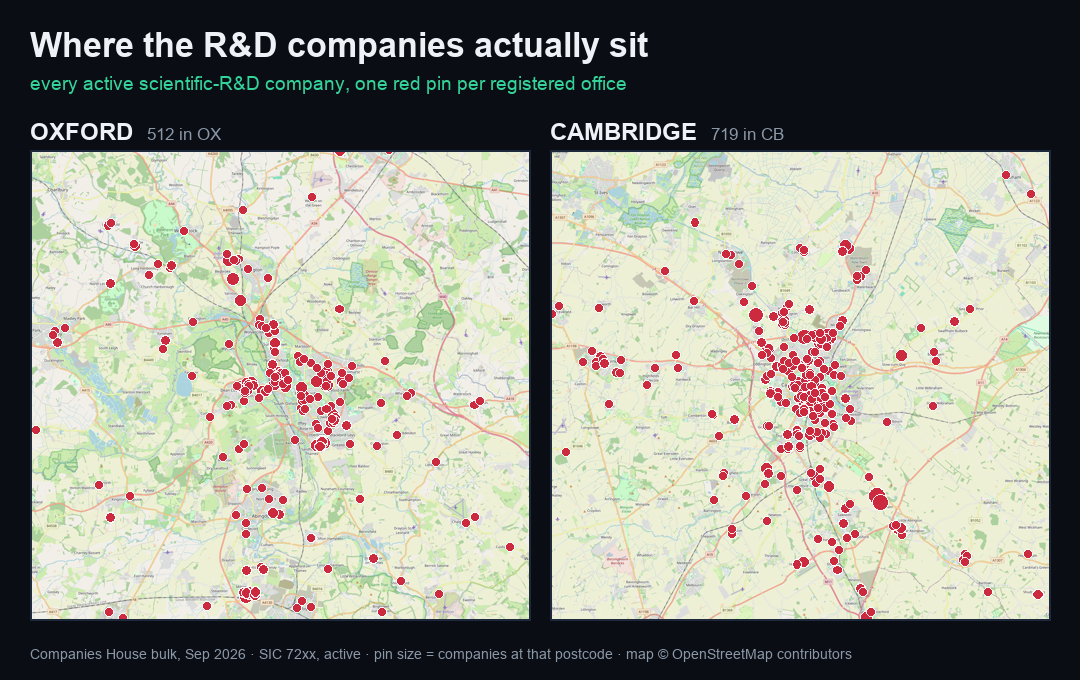
Two honest adjustments. First, brass plates are real and the busiest one in the region is in Cambridge: a single address, CB1 2GE, registered 604 new companies in 2025, and CB3 9EZ another 252 — formation agents, not labs. Strip addresses like those and Cambridge incorporated 3,344 companies in 2025 against Peterborough's 6,812. The bigger city files nearly twice the paper; almost none of it is science. Second, the boring-proxy test cuts the other way: Peterborough incorporated 369 food-service companies last year, Cambridge 154. Restaurants track population. R&D tracks the gown. Same land, different economies — and only one of them shows up in the price per terrace.
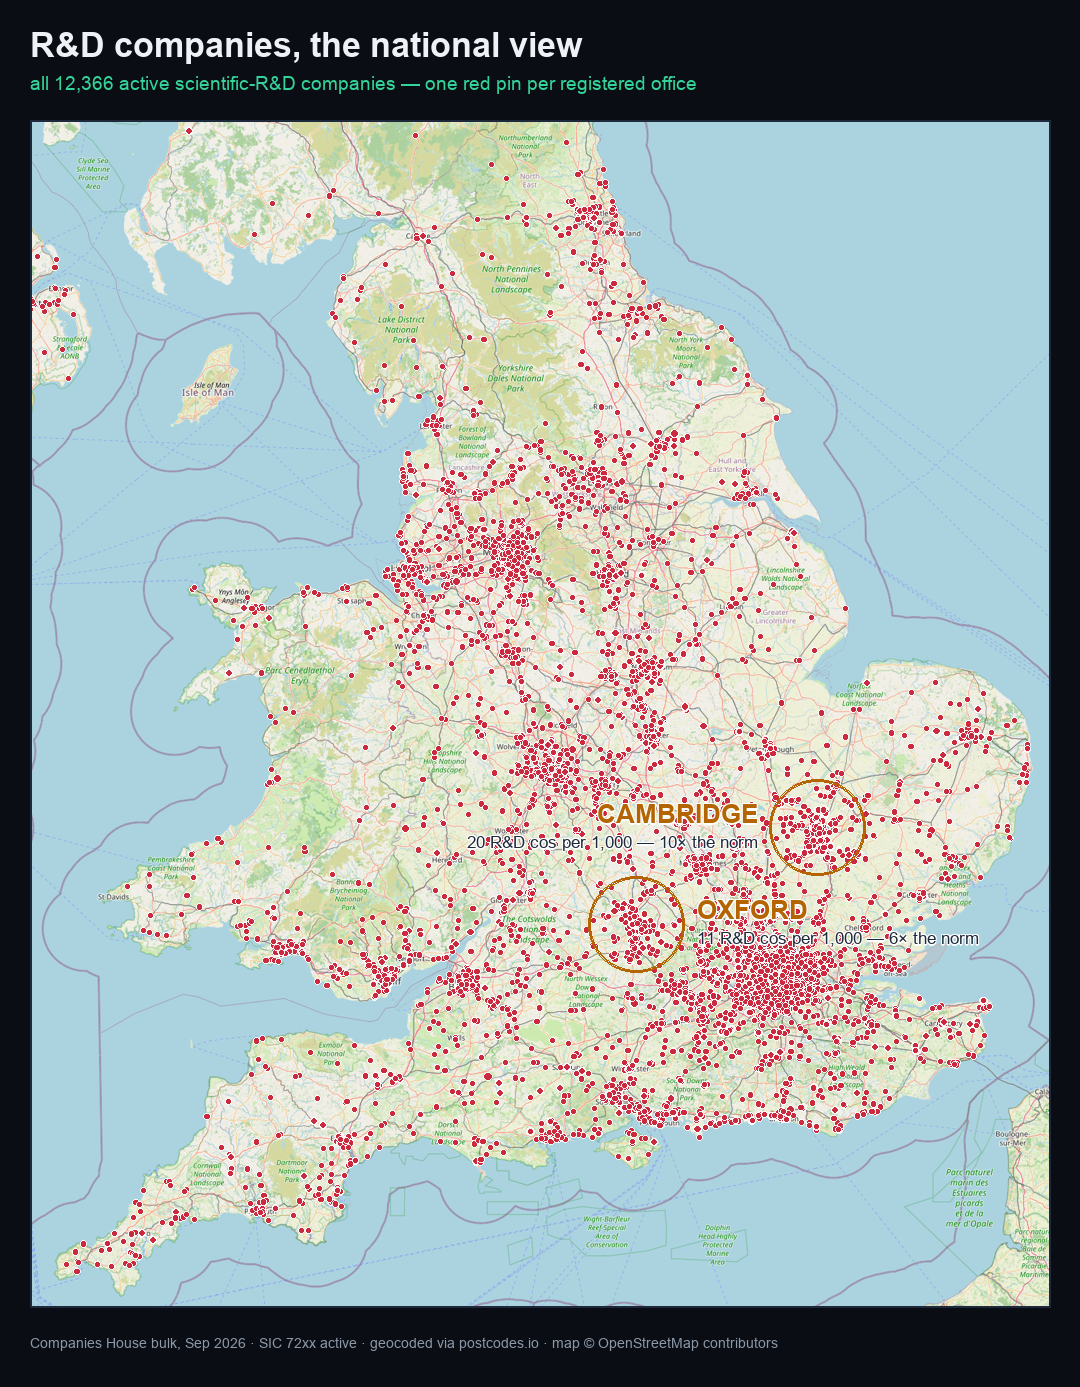
Zoom all the way out and you can draw England using nothing but its R&D companies — and the rarity of what the two university cities are jumps off the map. London glows because eight million people live there. Manchester and Birmingham glow because a million do. Cambridge, population 150,000, glows like all of them — and the Cambridge blob isn't even in the city: it spills south through the Babraham and Granta campuses into open countryside. There is nothing else like it in the country at that size; Oxford is the only thing close.
all prices are real: resale medians for the 12 months to 28 September 2026 (standard sales), growth from the UK House Price Index (average price, July 2015 → June 2026, local-authority areas); per-square-metre figures join price paid to EPC floor areas by address (97% match). Contains HM Land Registry data © Crown copyright and database right 2026, licensed under the Open Government Licence v3.0.
By Tom Meany, founder of Gaffon. Questions, quotes, or the underlying data (per-college title tables, the geocoded points, or any city cut): support@gaffon.com — answered same day.
Ready to list your home?
Our wizard walks you through everything, step by step — your details, photos, a video tour, a floorplan, pricing evidence from real sold prices — until your listing is ready and live.
List my home →Free to list · £10 one-time verified-owner badge · compare that with a typical £9,000 in fees