A Gaffon special · Dublin
Northside, Southside
— the €60,000 river
Every Dub knows the divide. We measured it. Crossing the Liffey costs €60,000 at the median — but that's the least interesting thing the register says. The growth has crossed the river: the northside now leads Dublin on price growth (Dublin 1: +8.6%), the €500k home — once a southside signature — is migrating north (northside sales over €500,000 have nearly tripled since 2021), and new companies at northside addresses are growing at more than twice the southside's pace — even after we strip out the brass-plate addresses. And the fastest-growing "Dublin" districts of all aren't in Dublin: they're in Ashbourne, Navan and Rush.
01
The divide, mapped
No official map of Dublin's postal districts exists, so we made one from the register itself: every geocoded sale carries its eircode, and the districts below are painted from 40,000 actual sales. Three views — second-hand homes only, then everything including new-builds, then the core up close. Same districts, same 12 months.
Map 1 · Resales only — second-hand homes; new-builds excluded
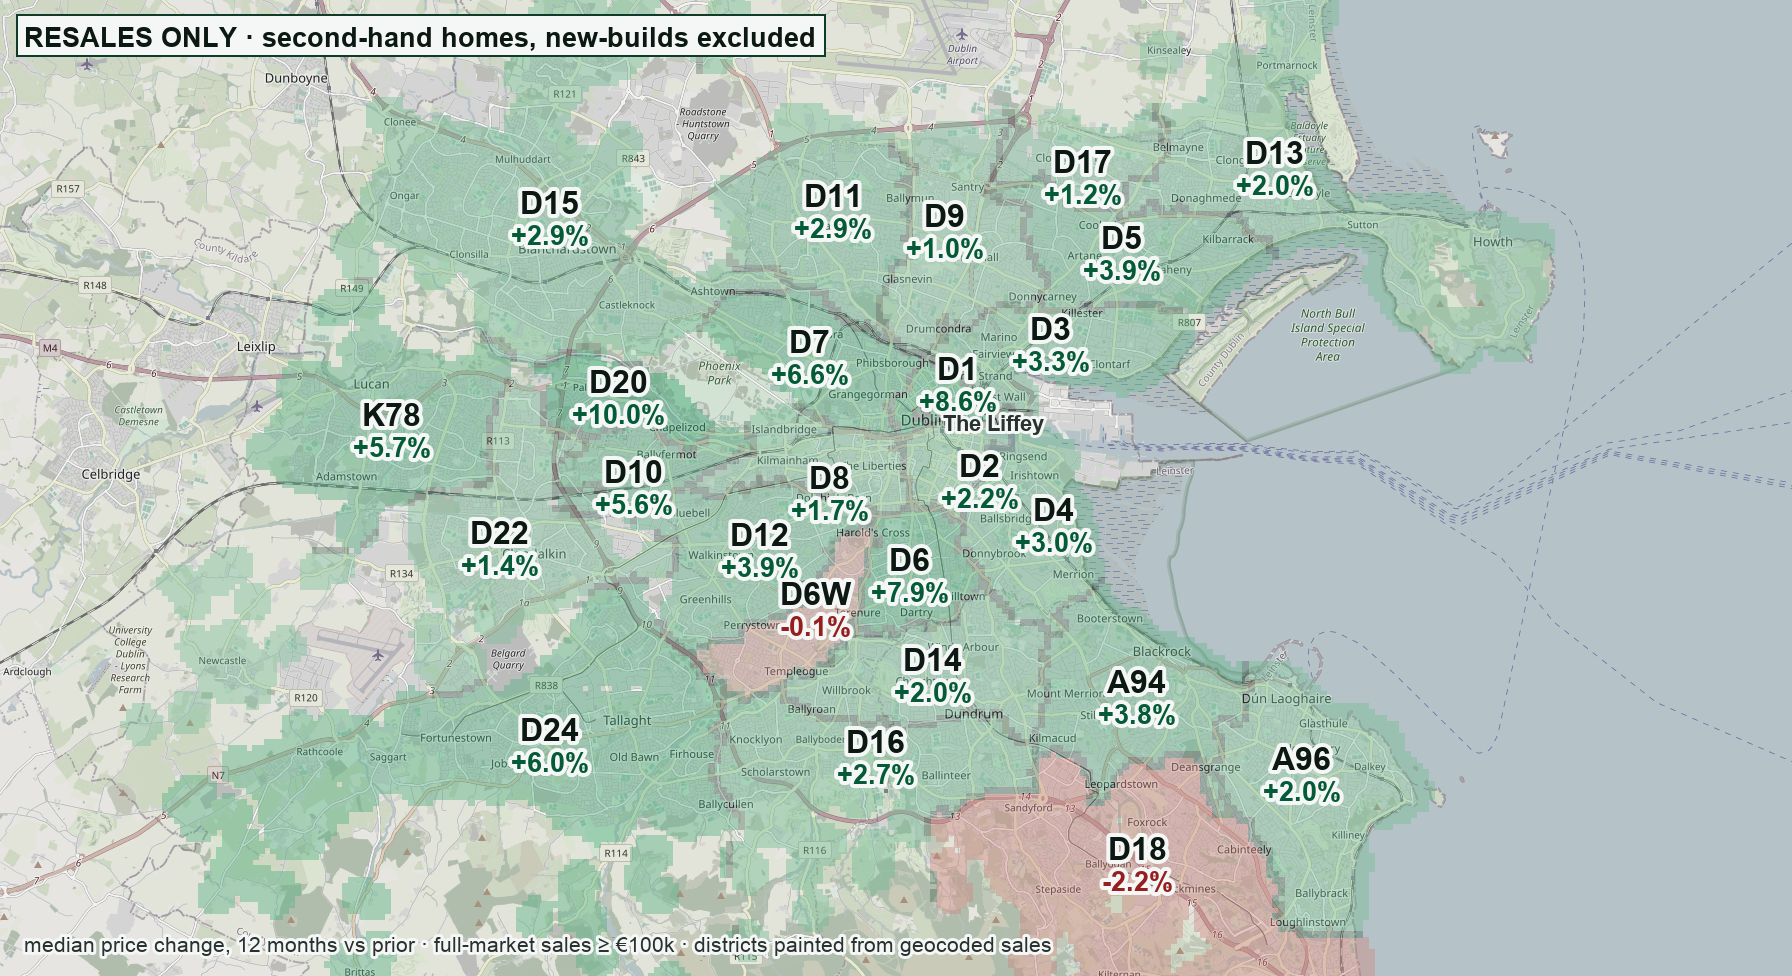
Second-hand median price change, last 12 months vs the prior 12, by eircode routing key. Basemap © OpenStreetMap contributors.
Look where the green is strongest. Dublin 20 (Palmerstown): +10%. Dublin 1: +8.6%. Dublin 7: +6.6%. Dublin 24: +6%. The old prestige belt tells the opposite story: Dublin 6W is dead flat, and Dublin 18 — Foxrock, Carrickmines, Cherrywood — is the only city district actually falling (−2.2%). The one southside exception is Dublin 6 itself (+7.9%, median €815,000): Ranelagh and Rathmines money doesn't read the same register as the rest of us. The spread within each side dwarfs the river gap — Dublin 6 is 2.5× Dublin 17, and southside Dublin 10 is cheaper than northside Dublin 3.
Map 2 · All sales — the same map, everything on the register, new-builds included
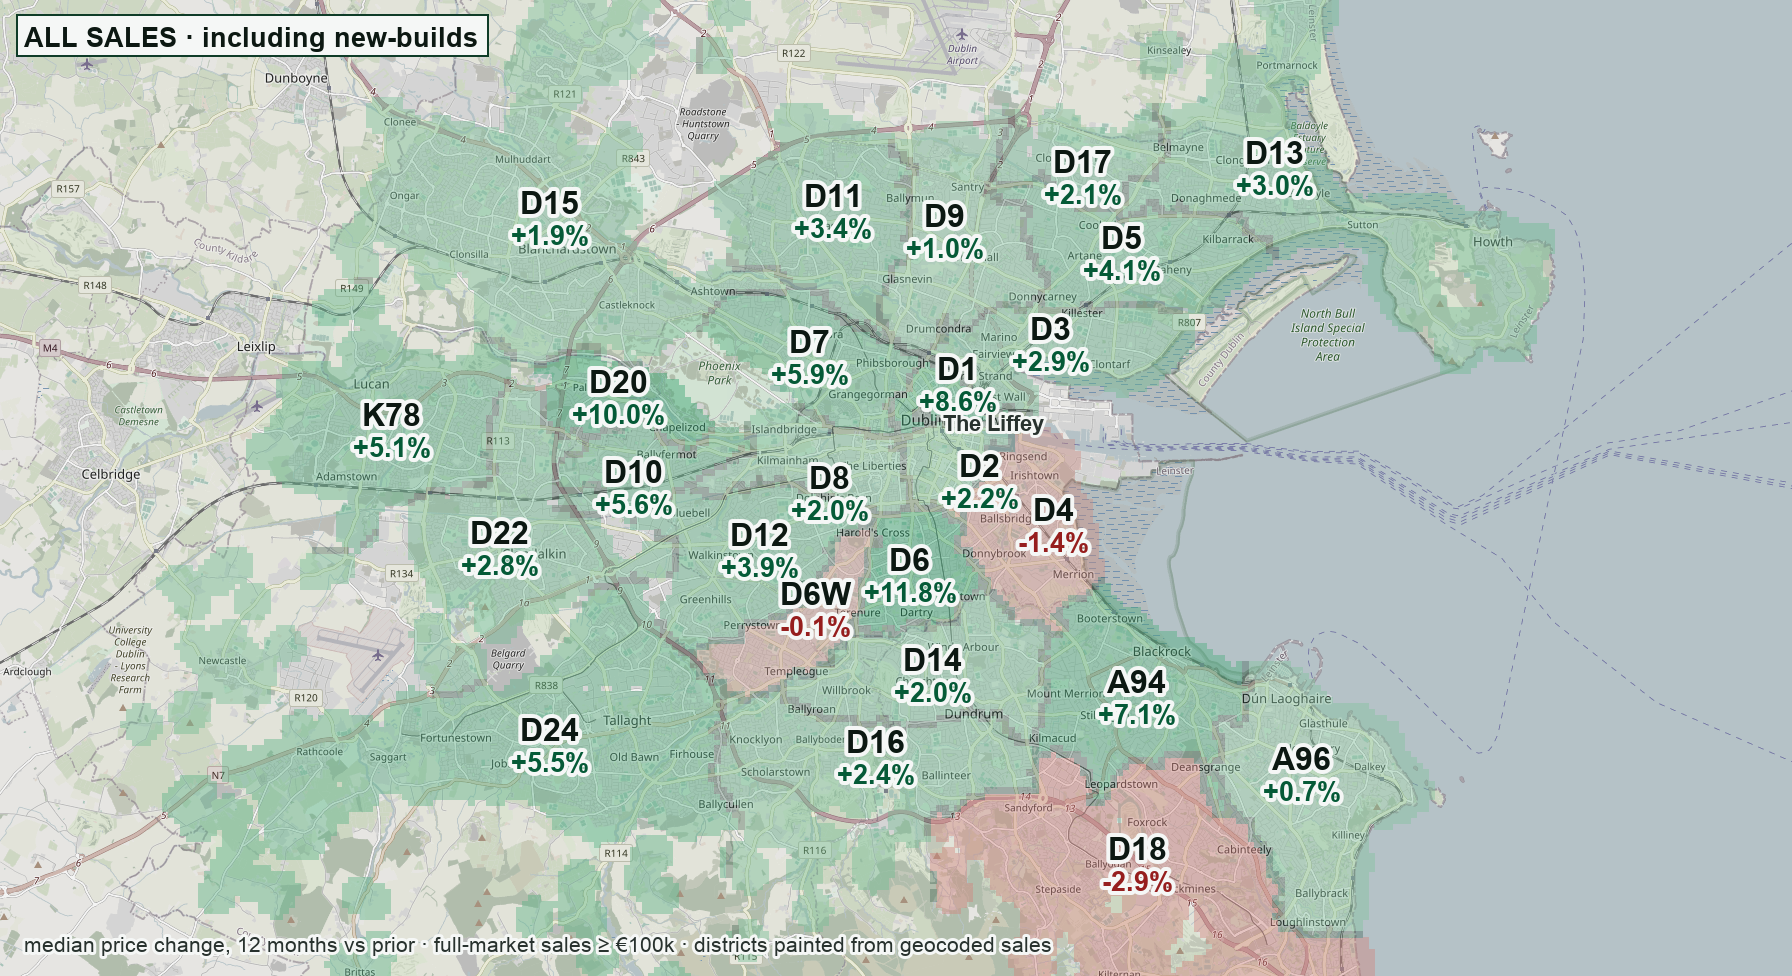
Same districts, same 12-month windows — every full-market sale counts, new-builds included.
The differences between the two maps are the apartment story. Dublin 4 flips from +3% to −1.4%: not falling houses, but new blocks at Grand Canal Dock arriving on the register below the house median. Blackrock (A94) jumps to +7.1% counting its new schemes. Dún Laoghaire barely moves. Where new homes land, the mix moves — which is exactly why we show both maps.
Map 3 · The core, up close — now zoom in: the Dublin Dubliners mean
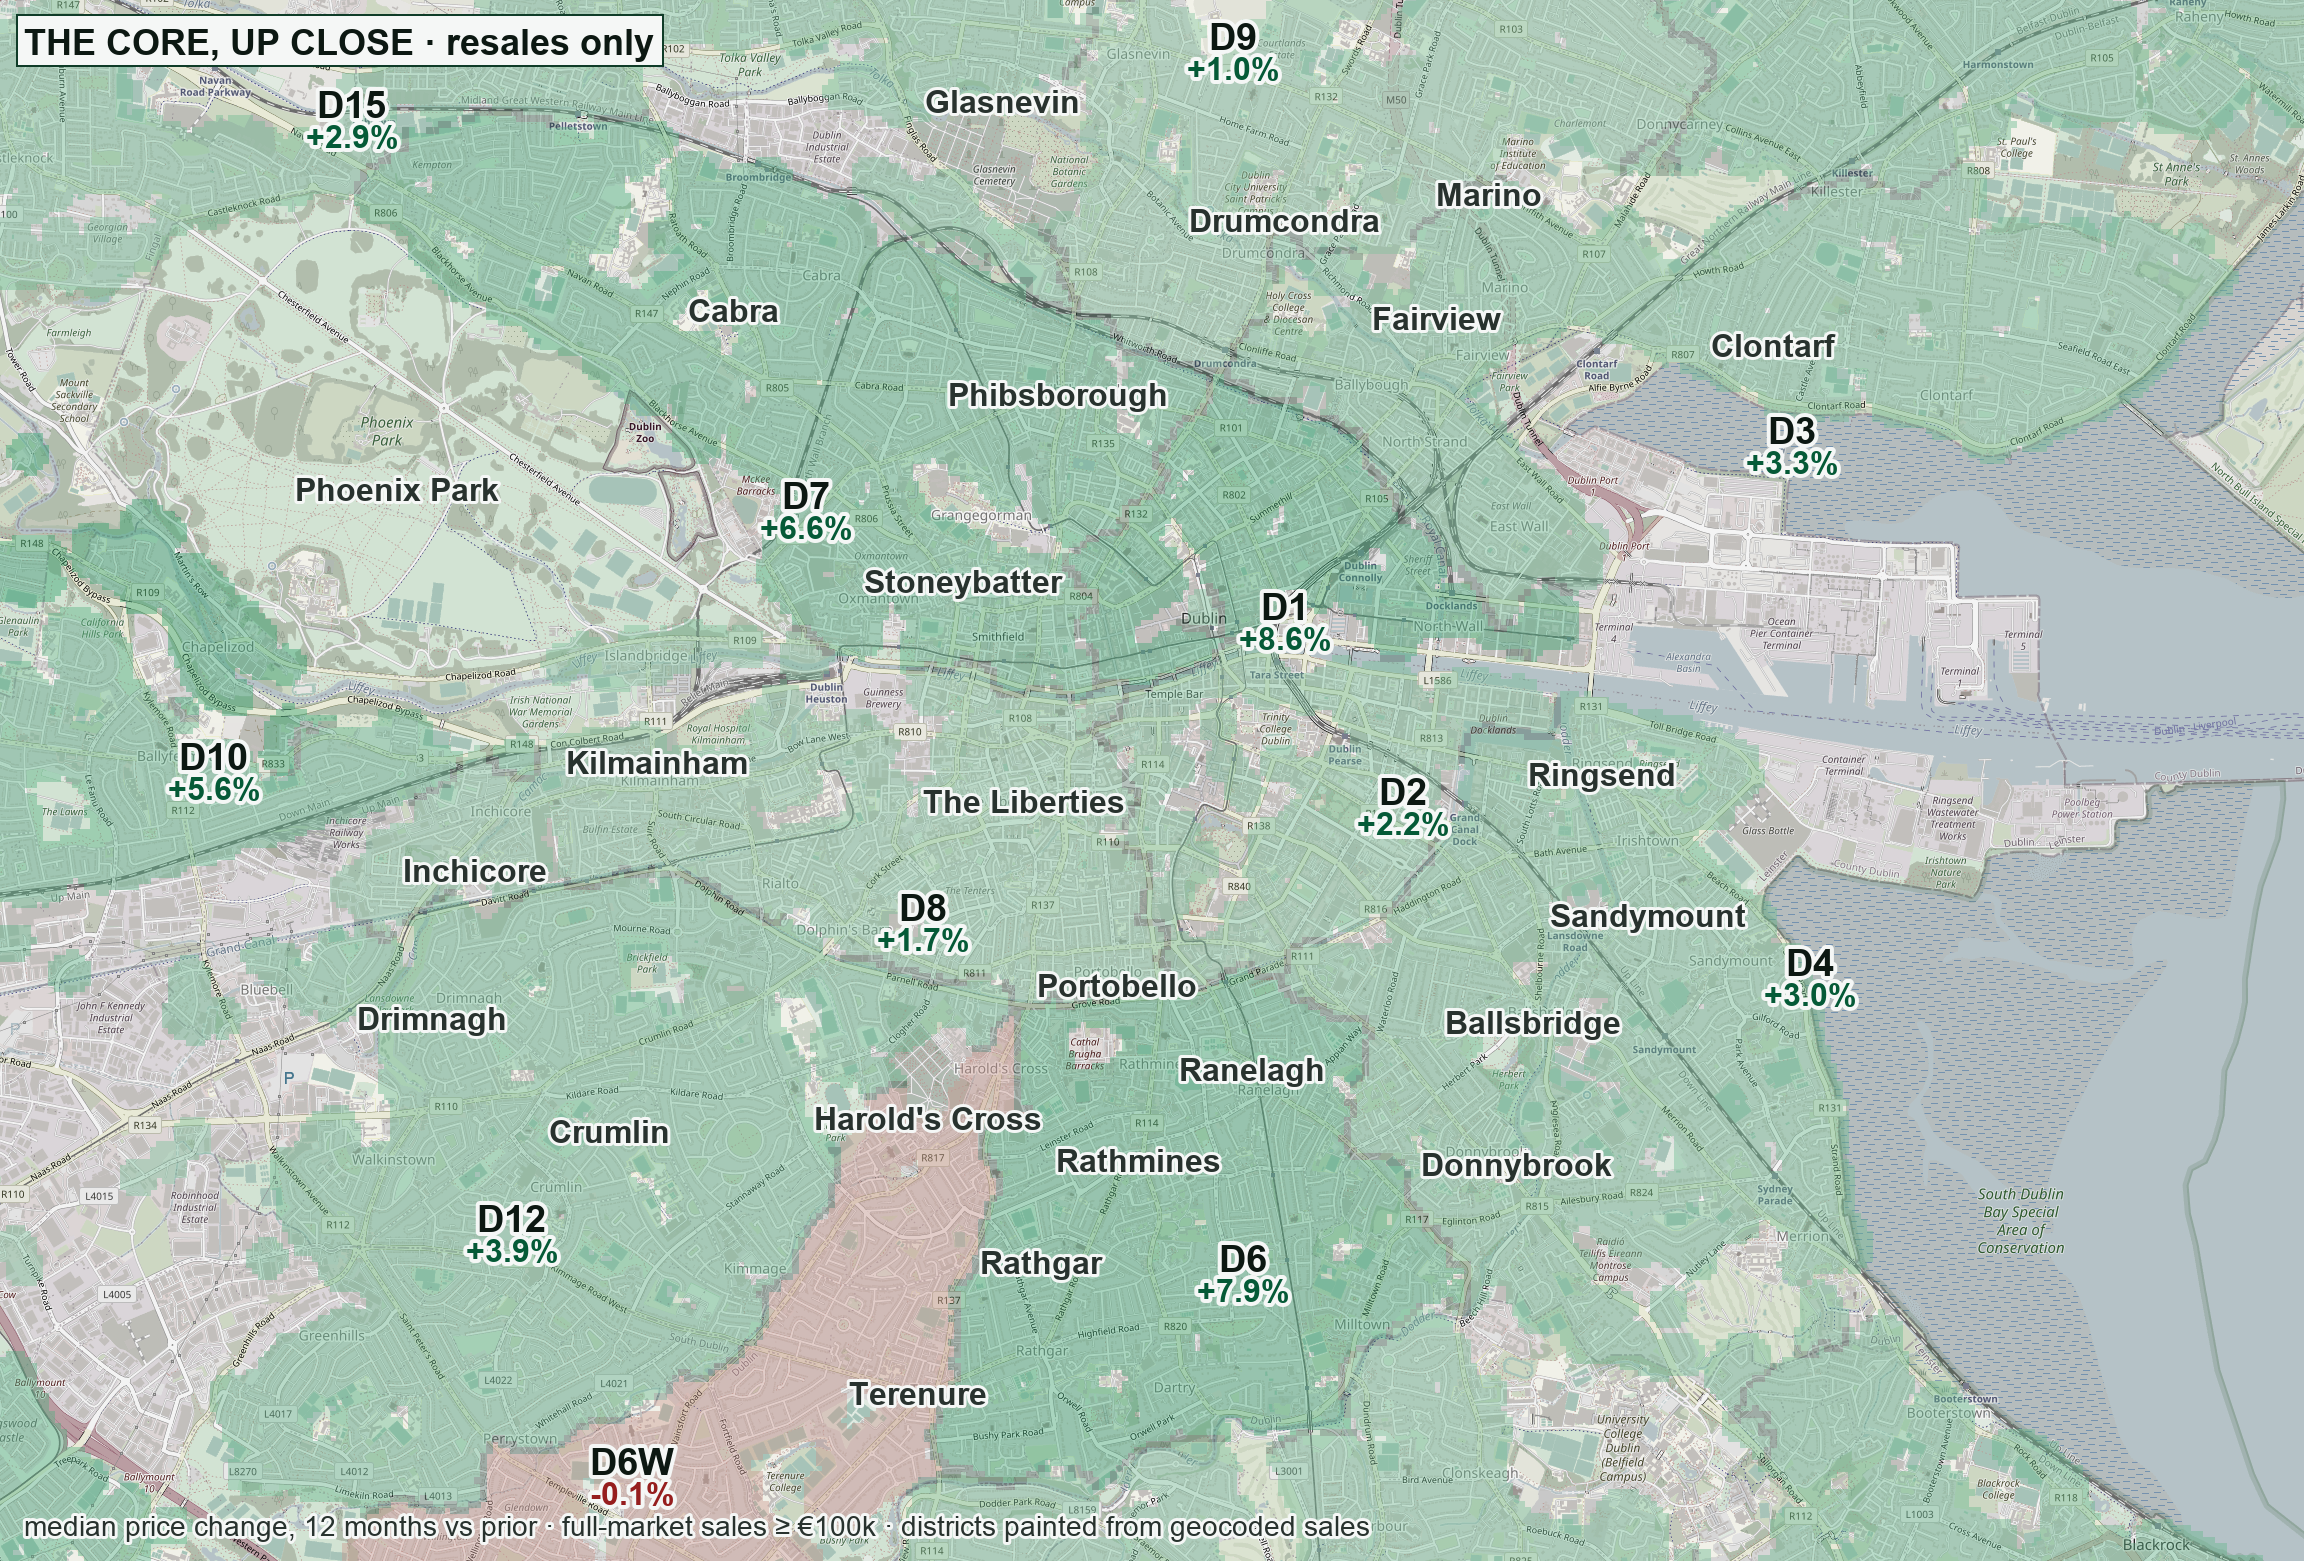
Same resale data as Map 1, cropped hard to the core — Glasnevin down to Terenure, Inchicore across to Clontarf. Unpainted patches (Phoenix Park, the port) are simply places where nothing sells.
Up close, the pattern sharpens: the strongest green in the core hugs the north inner city — Stoneybatter, Phibsborough, the D1 flats belt (+8.6%) — and the red patch isn't northside at all: it's Dublin 6W, Templeogue-Terenure West, dead flat while everything around it climbs. The Liberties and Dublin 8 (+1.7%) are the core's quiet corner; cross the river to Dublin 7 and the same kind of street is doing +6.6%.
02
Three postcards from the register
Districts are the map; streets are the story. Three neighbourhoods, three different Dublins — cut straight from the register by address.
Dublin 8 · northbank of the Camac
Inchicore: the steepest climb in Dublin
In 2021 the median Inchicore home sold for €305,000. In 2025: €441,000 — up 45%, the steepest climb of any neighbourhood we cut, on healthy volume (about 100 sales a year). Two houses have now sold within €100 of the million — both on Emmet Road and Inchicore Parade, streets that went for buttons a decade ago. Kilmainham next door ran the same race (€333,000 → €416,000). The last 12 months have gone quiet (median €420,000, slightly off) — the classic pattern of a neighbourhood catching its breath after repricing, not one giving the gains back.
Dublin 3 · where the money crossed
Fairview: the €2 million northside
Fairview's median went €398,000 (2021) → €505,000 (2025), and in December 2025 a house on Cadogan Road sold for €1.99 million — money that a few years ago simply did not buy north of the river. The whole coastal strip is moving together: Marino's 12-month median is €602,000, and Clontarf jumped from €735,000 to €885,000 in a single year — the sharpest big-neighbourhood rise on the northside. This is the half-million line from chapter 04 wearing actual addresses.
Dublin 18 · the southside's worst
Stepaside: the only place cheaper than 2021
Every neighbourhood in this piece is dearer than it was in 2021 — except one. Stepaside: €450,000 in 2021, €405,000 in 2025, down 7% in the last 12 months alone, on 118 sales. And that solves the Dublin 18 puzzle from Map 1: the district isn't falling because Foxrock is struggling — Foxrock's median just rose to €1,055,000. It's falling because the district's new-apartment belt — Stepaside, Cherrywood (€390,000), Sandyford (up just 7% in five years, against roughly 25% for the city) — keeps landing fresh supply on the register. Dishonourable mention across the M50: Dublin 6W, dead flat while every district around it rises. Where Dublin builds the most, prices behave — the rest of the city might take note.
03
The gap, measured
Take every second-hand sale in the city's postal districts and split it at the river. The southside median in 2026: €510,000. The northside: €450,000. That's the divide — €60,000, or 13.3%. Real, persistent… and shrinking: in 2022 the premium was 15.1%. Since 2021 the northside is up 26%, the southside 24%. Slowly, sale by sale, the river is getting cheaper to cross.
Median second-hand price by calendar year, city postal districts grouped by side of the Liffey (odd numbers north, even south); 2026 to 28 September.
04
The half-million line crosses the river
Medians hide the sharpest move on the register, so cut it differently: count the homes selling between €500,000 and €1 million — the trade-up band, the "good house in a good area" money. In 2021 that band was a southside signature: 29% of southside sales, just 17% of northside ones. By 2025 the northside count had gone from 594 to 1,727 — up 191% — against the southside's +104%. More than a third of everything sold on the northside now clears €500,000.
Second-hand city-district sales priced €500,000–€1M by calendar year and side of the Liffey.
Why? The dear side is old, rich and settled — it simply trades less. Put Drumcondra beside Ranelagh: between 2022 and 2025, Dublin 9's €500k–1M sales grew 69% (159 → 268) while Dublin 6's grew 11% (151 → 168) and Rathfarnham's Dublin 14 barely moved at all (+5%). Clontarf's Dublin 3 (+22%) and even Ballsbridge–Sandymount's Dublin 4 (+28%) trail the northside surge. The classic posh postcodes aren't getting cheaper — they're getting quieter, while the trade-up money that can't crack them buys Drumcondra, Glasnevin, Clontarf and Fairview instead, and drags those districts up the price ladder behind it.
+191%
northside €500k–1M sales, 2021 → 2025 (south: +104%)
17% → 35%
share of northside sales over €500k, 2021 → 2025
+69% vs +11%
Drumcondra (D9) vs Ranelagh (D6) in the band, 2022 → 2025
05
The northside opens for business
House prices follow money; company registrations show where it's being made — if you read them carefully. The raw register says Dublin 1 was the fastest company address in Dublin last year (+48.7%). We didn't believe it, and neither should you: the north inner city is full of solicitors' offices and formation agents whose address goes on other people's companies. 61% of Dublin 1's 2025 filings sit at addresses registering ten or more companies that year — one D1 address filed 164 companies; one in Dublin 7 filed 213.
So we filtered every one of those brass-plate addresses out, on both sides of the river — and the story survives: clean incorporations grew +13.4% at northside addresses against +6.1% southside — still more than double the pace. Dublin 1 falls back to an honest +7.7%, and the real champions turn out to be the workshop postcodes with barely a brass plate to their name: Dublin 13 (Baldoyle–Clongriffin) +22.9% and — credit where due, southside — Dublin 12 (Crumlin–Walkinstown) +24.5%. Leafy Dublin 6? Down 4.9% clean. The IFSC-and-docklands giant Dublin 2 still files the most but its clean count grew just 0.6%.
New company incorporations by registered-office postal district, grouped by side of the Liffey (all filings, before the brass-plate filter). About two-thirds of Dublin filings carry an eircode; both sides are measured identically, so the comparison is apples-to-apples. Source: CRO open data.
County-wide, Dublin incorporated 11,421 companies in 2025 — up a modest 7.6%, the slowest of Ireland's big counties (Limerick, for comparison, grew 22.2%). Dublin's growth isn't a county story. It's a northside story — and it holds up with the lawyers taken out.
+13.4% / +6.1%
northside vs southside incorporations 2025, brass-plate addresses excluded
+24.5% / +22.9%
Dublin 12 and Dublin 13 clean growth — the real champions
−4.9%
Dublin 6, same clean measure
06
Who's buying, door by door
The register never names buyers, but the CSO's stamp-duty data splits household purchases by Eircode — first-time buyer, mover, or non-occupier — and it redraws the map one more time. Start where the price maps are darkest: 29% of Dublin 1's 2025 purchases went to non-occupiers — landlords, second addresses, buyers who won't live there — against 10% nationally. Docklands Dublin 2 runs at 26%, the Dublin 8 flat-land at 17%. And Dublin 4's non-occupiers pay a €580,000 median where the national absentee buyer pays €250k — investor money at trophy prices.
Where do first-timers actually get keys? The west: Dublin 22 · Clondalkin (59%), Lucan (K78) (59%), Dublin 10 · Ballyfermot (56%) and Dublin 17 · Coolock–Darndale (52%) — every one of them in the cheap half of the maps in chapter 01, and every one far above the 39% national first-timer share.
And the trade-up fortress from chapter 04 shows up exactly where it should: in Ranelagh–Rathmines, Rathfarnham, Blackrock, Glenageary and Terenure the first-timer share is stuck around a quarter, with two-thirds of every sale going to a mover — people trading up swapping with people trading up. The most settled market in the county is Skerries: 83% movers, 14% first-timers. The doors change hands; the kind of buyer never does.
29%
Dublin 1 purchases going to non-occupiers — 3× the national rate
59%
first-time-buyer share in Clondalkin and Lucan — Dublin's FTB belt
83%
mover share in Skerries — the most settled market in the county
Market household purchases, stamp-duty executions, 2025, by Eircode routing key. Company and fund purchases aren't published below county level. Source: CSO (table HPA04).
07
The wealth check
New-car registrations — the classic disposable-income tell — say the money is real. Dublin licensed 45,017 new private cars in 2025, up 25.7% since 2022 — the fastest growth of any Irish city and finally back above the pre-pandemic 2018 level. The tell within the tell: Kildare (+25.3%) and Meath (+18.3%) are right behind, because a growing share of "Dublin" wealth now parks overnight outside the county.
2018
44.5k
2019
44.4k
2020
28.8k
2021
36.5k
2022
35.8k
2023
43.2k
2024
43.4k
2025
45.0k
New private cars licensed for the first time, Dublin licensing authority, calendar years. Source: CSO (table TEA29).
08
The escape routes
Here's the twist the city maps can't show: the fastest-growing "Dublin" districts aren't in Dublin. Follow the M-roads out and the register lights up — Rush +16.2%, Ashbourne +13.3%, Navan +10.2% — all still €60,000–€130,000 cheaper than the city's northside median. The buyers Dublin priced out are all making the same move, and they're taking the boom with them.
| Belt town | Median (12m) | Change | Sales |
|---|---|---|---|
| Rush & Lusk · K56 | €445,000 | +16.2% | 80 |
| Ashbourne · A84 | €391,000 | +13.3% | 162 |
| Navan · C15 | €377,000 | +10.2% | 559 |
| Maynooth–Celbridge–Leixlip · W23 | €480,000 | +6.6% | 532 |
| Naas · W91 | €440,000 | +6.5% | 804 |
| Skerries · K34 | €575,000 | +6.5% | 107 |
| Lucan · K78 | €465,000 | +5.7% | 382 |
| Malahide · K36 | €635,000 | +5.0% | 339 |
| Bray · A98 | €513,000 | +3.0% | 324 |
| Swords · K67 | €420,000 | +1.9% | 425 |
| Balbriggan · K32 | €330,000 | +1.5% | 237 |
| Donabate · K45 | €405,000 | -4.7% | 67 |
Second-hand sales by eircode routing key, last 12 months vs prior. Small samples wobble — Donabate's −4.7% is 67 sales.
The building has moved out there too. Of the busiest new-build districts in the last 12 months, half are outside the city: Naas sold 45 new homes, Lucan 29, Malahide 28, Maynooth–Celbridge 25, Navan 22 — while inside the city the cranes cluster in Cherrywood (85), Blanchardstown (80) and the Dublin 4 docklands (53).
Now
You've seen the data. Now go see the homes.
3,106 homes for sale in Dublin right now, median asking €400,000. Every link opens the live map.
How is your patch doing?
Stick in your eircode — or your town — and we compute what sold around you, live from the register. Then go snoop on the map.
Quick answers
Is the northside of Dublin really cheaper than the southside?
Yes — by about €60,000 at the median. Across the city's northside postal districts the median second-hand home sold for €450,000 in 2026; across the southside, €510,000. But the gap is narrower than the talk: 13.3%, down from 15.1% in 2022, and the spread WITHIN each side is far bigger — Dublin 6 (€815,000) is two and a half times Dublin 17 (€332,000), and southside Dublin 10 (€338,000) is cheaper than northside Dublin 3 (€531,750).
Where are Dublin house prices rising fastest?
On clean second-hand data over the last 12 months: Dublin 20 (Palmerstown) +10%, Dublin 1 +8.6%, Dublin 6 +7.9%, Dublin 7 +6.6%, Dublin 24 +6% — three of the top five are northside. The dearest southside districts have stalled: Dublin 6W flat (-0.1%), Dublin 18 falling (-2.2%). And the commuter belt beats nearly everything: Rush +16.2%, Ashbourne +13.3%, Navan +10.2%.
Is the northside catching up with the southside?
The register says yes — fastest in the €500k–€1M trade-up band, where northside sales have grown 191% since 2021 against the southside's 104%, and on business: even after excluding brass-plate addresses (solicitors and formation agents registering ten or more companies a year), northside incorporations grew 13.4% in 2025 against 6.1% southside. Dublin 6's filings fell 4.9% on the same clean measure. The money that trades up and starts companies is landing north of the river.
Should I buy in Dublin or the commuter belt?
The register won't decide for you, but it shows the trade: a median Dublin city home costs €450,000–€510,000 depending on the side of the river, while Navan (€377,000), Ashbourne (€391,000) and Naas (€440,000) sit well below — and they're growing faster (+10.2%, +13.3%, +6.5%). That gap is exactly why the belt is growing: the buyers Dublin priced out are all making the same move.
Want the stories inside these numbers? Read our research pieces — who is buying Ireland, what a university does to house prices, and more, all from the same public registers.
Sources & method
tap to open
- Sold prices: Residential Property Price Register, propertypriceregister.ie (PSRA). Full-market-price transactions of €100,000+ only; "resales" additionally exclude new-build schemes. Districts are eircode routing keys (roughly 80% of Dublin sales since 2021 carry an eircode; the north/south series therefore starts in 2021). Medians are approximate; map percentages compare the last 12 months with the prior 12; yearly series are calendar years, 2026 to 28 September.
- District map: no official polygon set exists for Dublin postal districts, so each map pixel is classified by majority vote of the nearest geocoded sales (about 40,000 points, Sept 2023–2026). Areas more than ~500m from any sale are left unpainted. Basemap © OpenStreetMap contributors.
- Company incorporations: Companies Registration Office open-data register, opendata.cro.ie — contains Irish Public Sector Data (CRO) licensed under CC BY 4.0. County totals by registered address; district cuts by registered-office eircode routing key (about two-thirds of Dublin filings carry one; both sides of the river measured identically). "Clean" figures exclude every address that registered ten or more companies in the year — the solicitor, accountant and formation-agent offices whose address appears on other people's companies. That filter removes 61% of Dublin 1's raw 2025 filings and 53% of Dublin 7's.
- Neighbourhood postcards: address-text cuts of the same register ("Inchicore", "Fairview", "Stepaside", etc. appearing in the sale address), second-hand full-market sales; 2021 and 2025 figures are calendar-year medians, "last 12 months" runs to 28 September 2026. Address text is messier than an eircode — treat these as honest estimates on 50–200 sales each, not gospel.
- The €500k–1M band: same register, second-hand full-market sales in the city's postal districts priced €500,000–€999,999, counted per calendar year and side of the Liffey. Growth figures compare 2021 with 2025 (both full years); the district face-off compares 2022 with 2025.
- Buyer types: CSO PxStat, table HPA04 ("Market-based Household Purchases of Residential Dwellings" by Eircode output, buyer type and year) — stamp-duty executions, 2025, market purchases by households only. Non-household buyers (companies, funds, councils, AHBs) are published by county, not by Eircode, so district figures describe the household market.
- New-car registrations: CSO PxStat, table TEA29 ("New Private Cars Licensed for the First Time by Licensing Authority"), calendar years.
- Listings: Gaffon's live corpus, 28 September 2026. Small samples are flagged wherever they matter — that's the deal here.